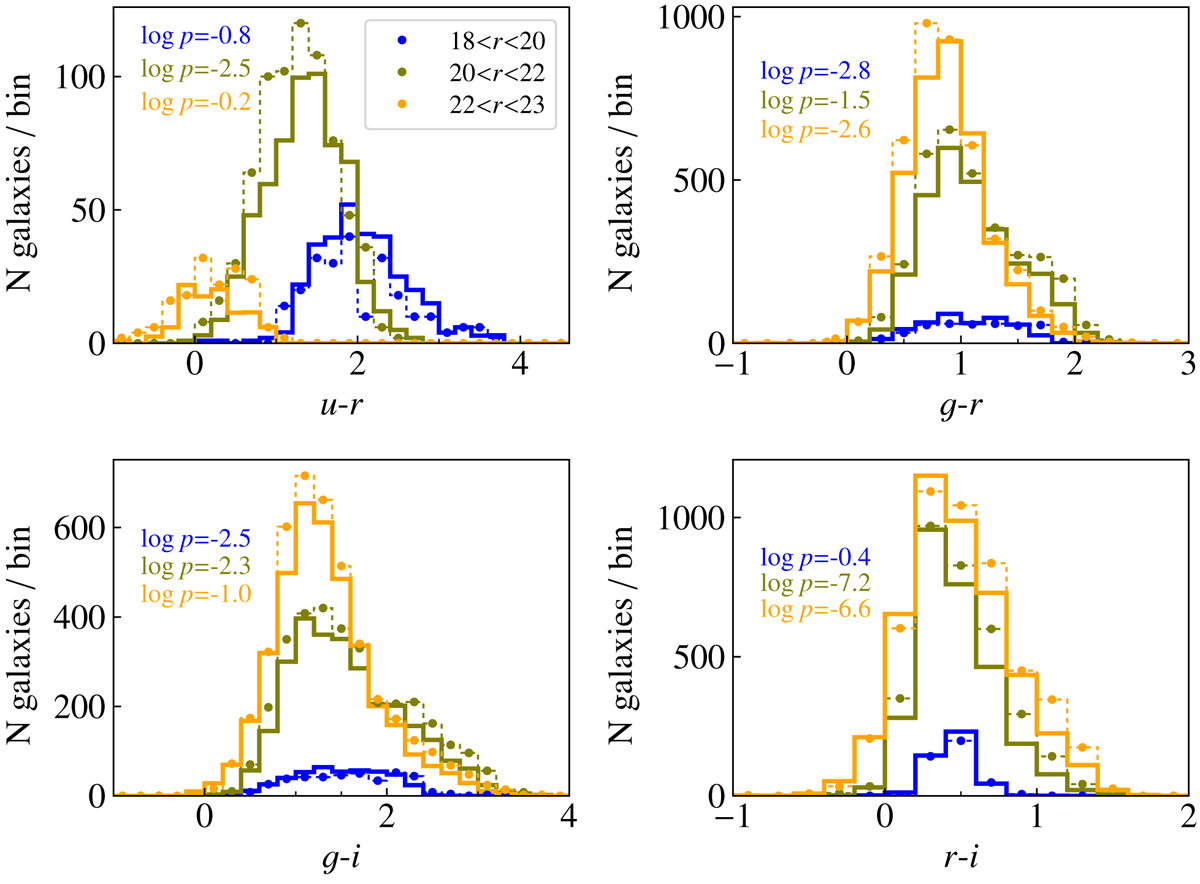
Fig. 29.
Download original image
Distribution of the observed broad-band colours in three bins of magnitude. Each plot only includes sources with > 3σ detections in the two bands defining the colour index and with valid photo-z estimates. Solid lines show the distributions measured for galaxies in the photo-z-only sample. Connected dots represent the distribution for galaxies in the spectroscopic sample (scaled by a factor 2 to facilitate the comparison).
Current usage metrics show cumulative count of Article Views (full-text article views including HTML views, PDF and ePub downloads, according to the available data) and Abstracts Views on Vision4Press platform.
Data correspond to usage on the plateform after 2015. The current usage metrics is available 48-96 hours after online publication and is updated daily on week days.
Initial download of the metrics may take a while.