Free Access
Fig. 28.
Download original image
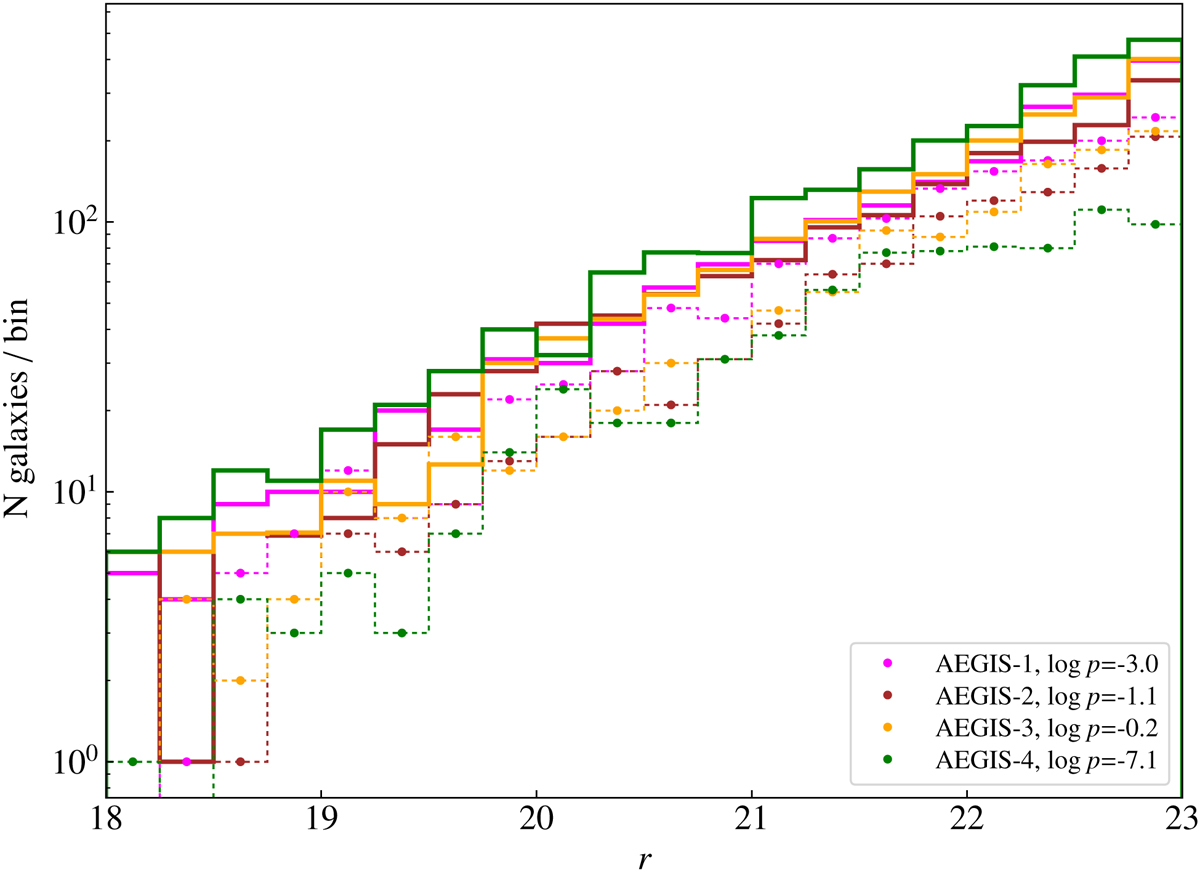
Distribution of the observed r-band magnitude of miniJPAS galaxies for the photo-z-only sample (solid lines) and the spectroscopic sample (connected dots) for individual pointings. log p-values in the legend indicate the probability of the spectroscopic and photo-z-only samples being drawn from the same parent population.
Current usage metrics show cumulative count of Article Views (full-text article views including HTML views, PDF and ePub downloads, according to the available data) and Abstracts Views on Vision4Press platform.
Data correspond to usage on the plateform after 2015. The current usage metrics is available 48-96 hours after online publication and is updated daily on week days.
Initial download of the metrics may take a while.