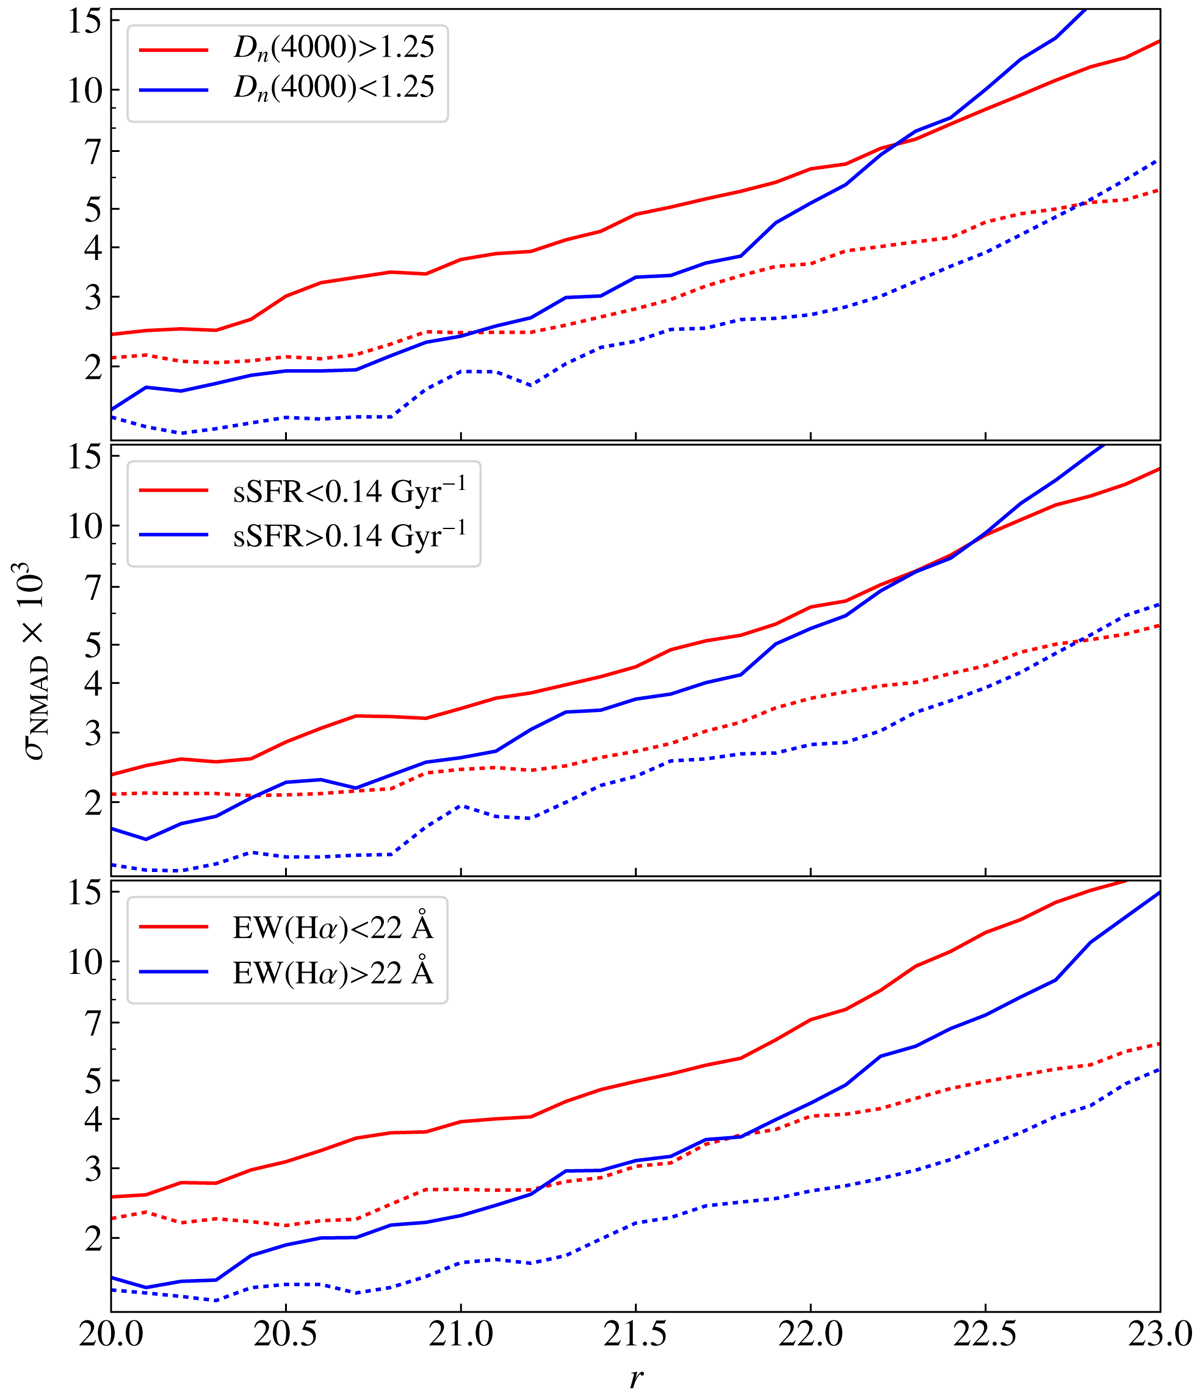
Fig. 26.
Download original image
Variation in σNMAD as a function of the cut applied in r-band magnitude separately for red and blue galaxies. Each panel shows results for a different way of classifying the galaxies, using the strength of the 4000 Å break (top), the specific instantaneous SFR (middle), and the equivalent width of Hα (bottom). Solid lines correspond to σNMAD values at 100% completeness (no cut in odds), and dotted lines indicate σNMAD values for a cut in odds corresponding to 50% completeness.
Current usage metrics show cumulative count of Article Views (full-text article views including HTML views, PDF and ePub downloads, according to the available data) and Abstracts Views on Vision4Press platform.
Data correspond to usage on the plateform after 2015. The current usage metrics is available 48-96 hours after online publication and is updated daily on week days.
Initial download of the metrics may take a while.