Fig. 23.
Download original image
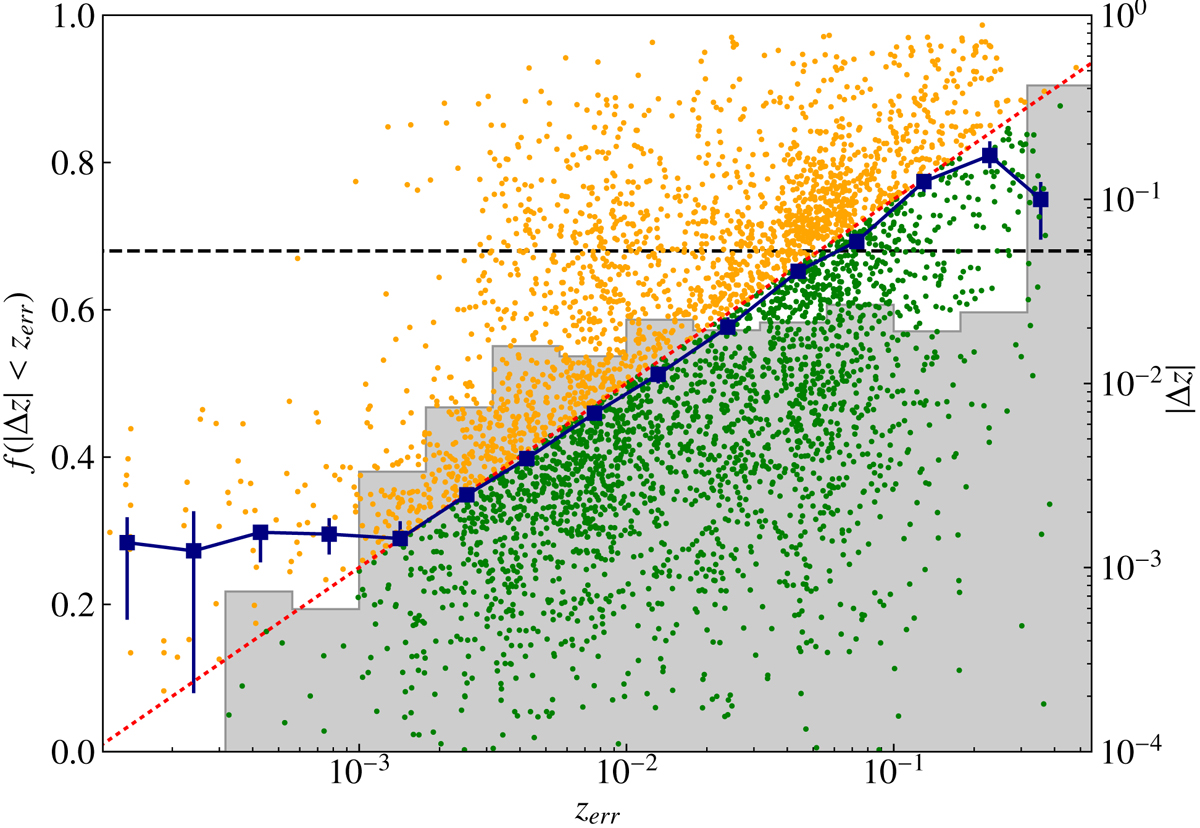
Distribution of the fraction of galaxies with |Δz| < zerr as a function of zerr (grey histogram). The horizontal line marks a fraction of 68% expected if zerr estimates are accurate. Small dots indicate the zerr and |Δz| of individual galaxies (right scale). The dots are orange and green for |Δz| > zerr and |Δz| < zerr, respectively. The dotted red line marks the expected σNMAD as a function of zerr, while the connected dark blue squares with error bars indicate the observed σNMAD and the 16–84th percentiles of its confidence interval.
Current usage metrics show cumulative count of Article Views (full-text article views including HTML views, PDF and ePub downloads, according to the available data) and Abstracts Views on Vision4Press platform.
Data correspond to usage on the plateform after 2015. The current usage metrics is available 48-96 hours after online publication and is updated daily on week days.
Initial download of the metrics may take a while.