Fig. 18.
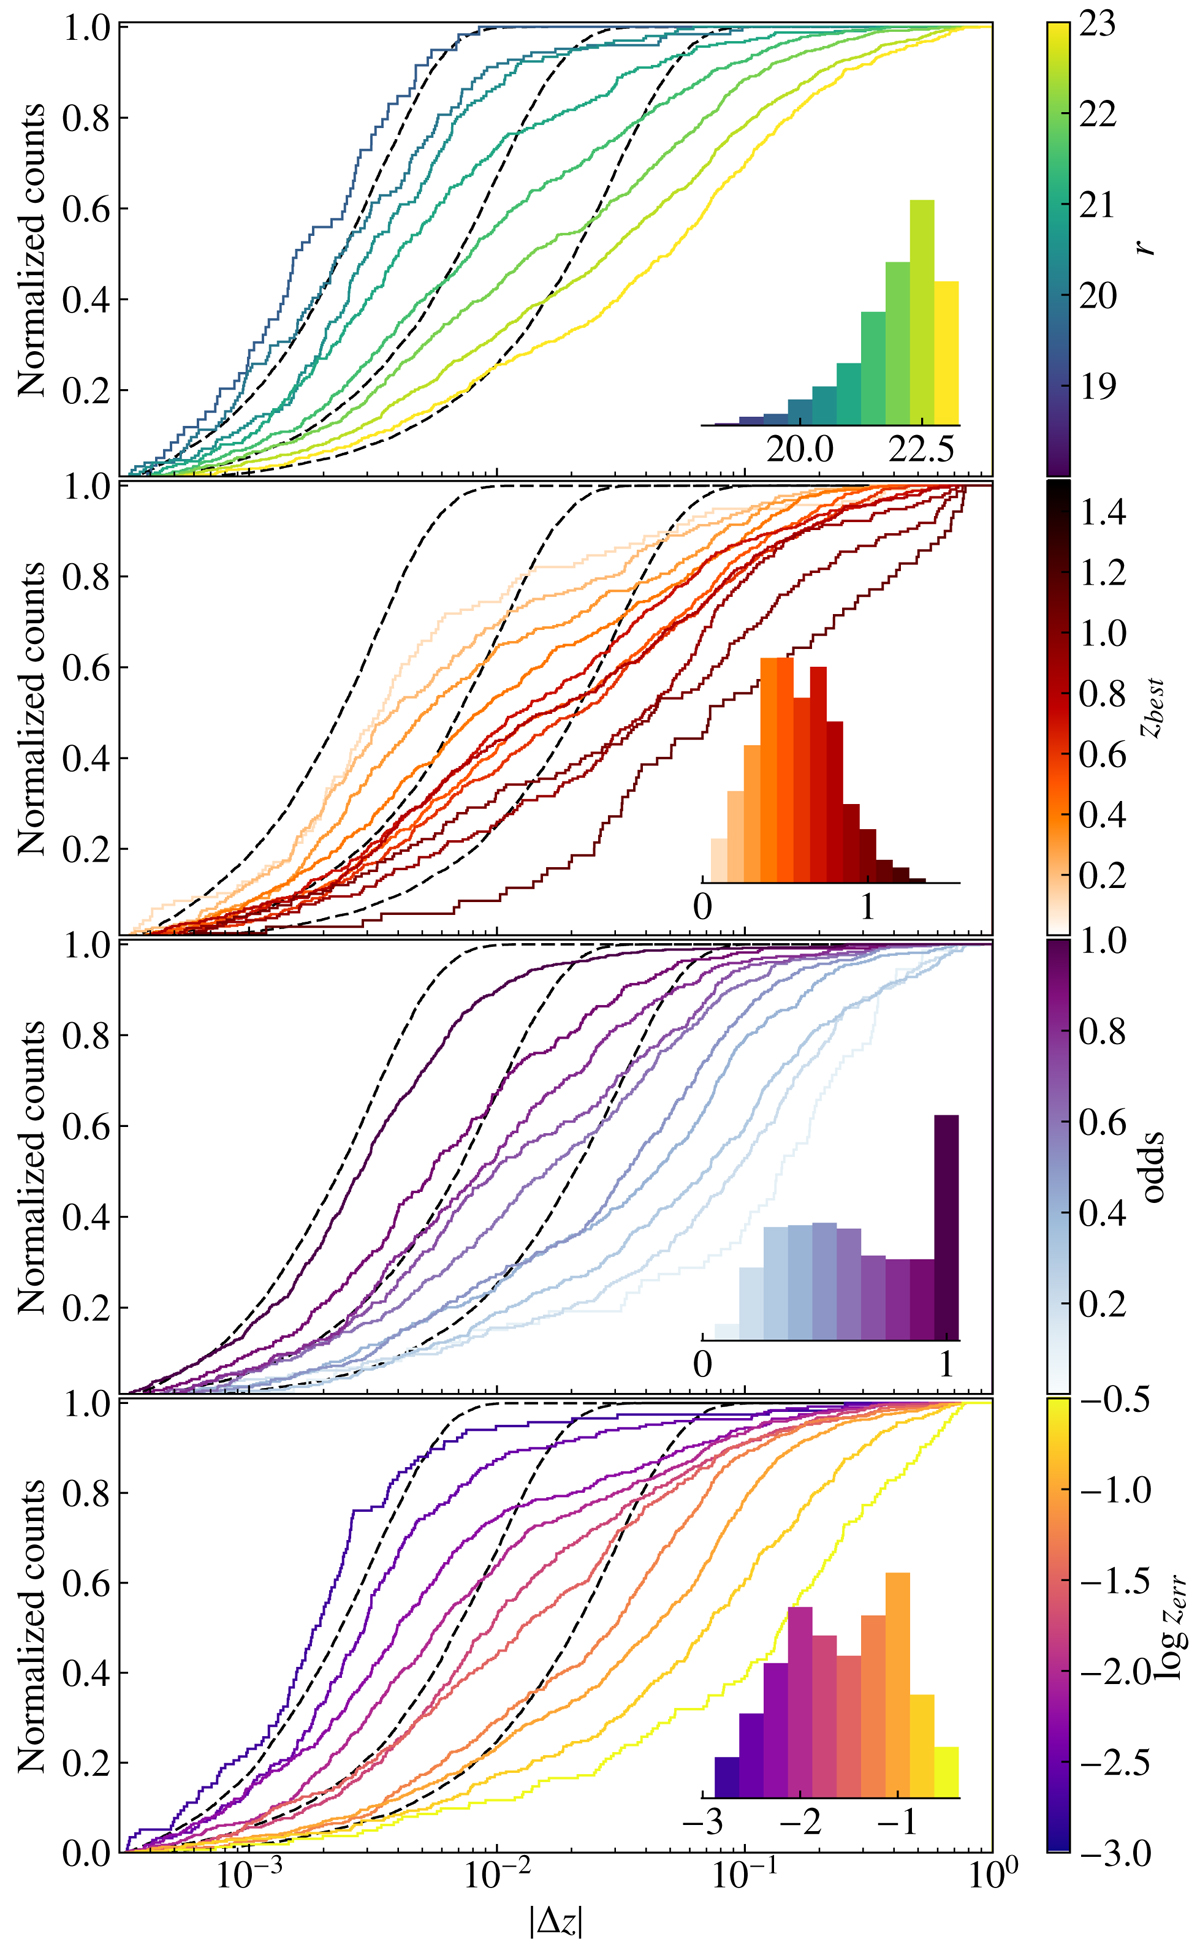
Download original image
Cumulative distributions of |Δz| for subsets of the spectroscopic sample within specific intervals of (from top to bottom) the r-band magnitude, zbest, odds, and zerr. Dashed lines represent predictions for a Gaussian distribution of Δz centred at Δzsys = 0.001 and with standard deviations of 0.003, 0.01, and 0.03, and solid lines show the actual distributions for galaxies inside each bin. The inset plots on the right of the panels represent the relative number of galaxies contributing to each bin, coloured according to the central value of the bin. Cumulative distributions for bins containing fewer than 50 galaxies are not shown.
Current usage metrics show cumulative count of Article Views (full-text article views including HTML views, PDF and ePub downloads, according to the available data) and Abstracts Views on Vision4Press platform.
Data correspond to usage on the plateform after 2015. The current usage metrics is available 48-96 hours after online publication and is updated daily on week days.
Initial download of the metrics may take a while.