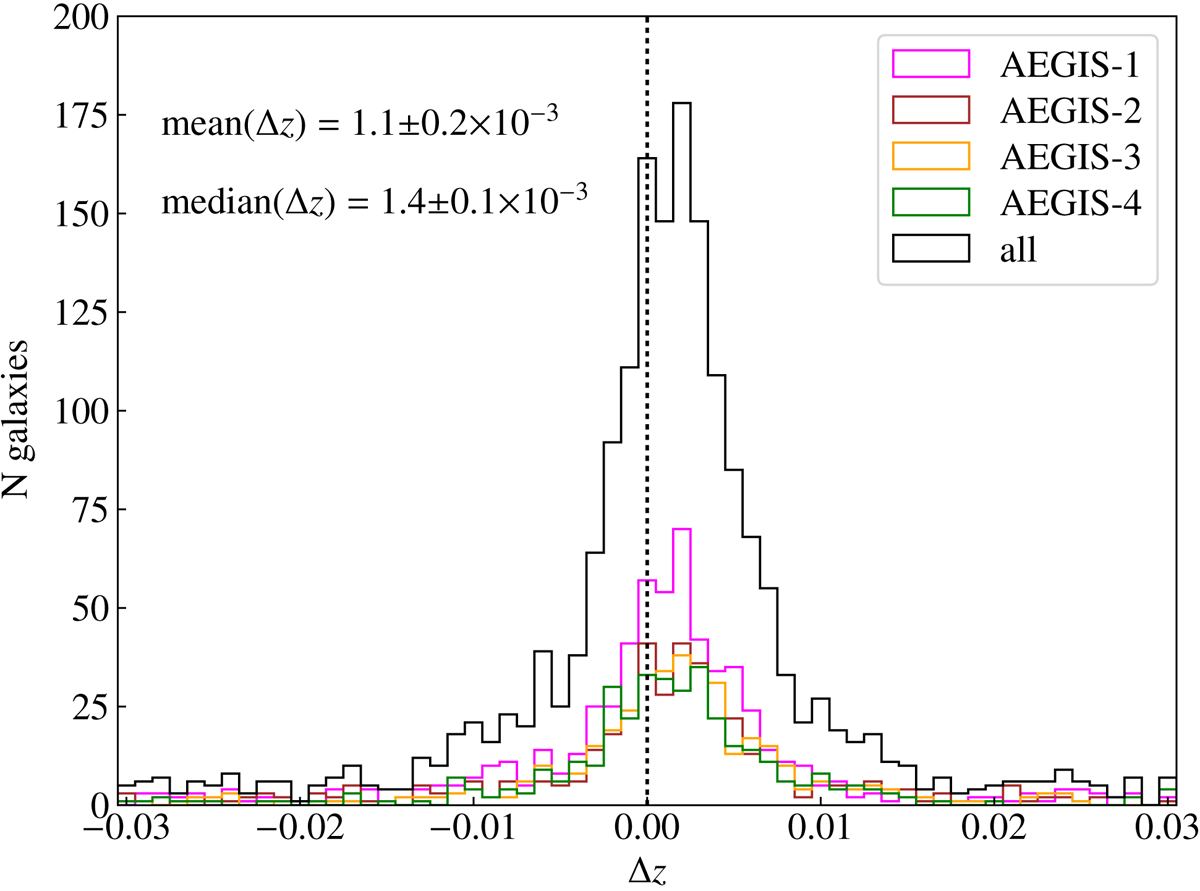
Fig. 15.
Download original image
Distribution of the error in zbest, Δz, for the galaxies in the spectroscopic sample. The tails of the distribution at |Δz| > 0.03 are truncated to emphasise the shape of the central peak. Only sources with odds > 0.61 are shown. Each colour represents the distribution for an individual pointing. The black histogram represents the combined distribution for all four pointings.
Current usage metrics show cumulative count of Article Views (full-text article views including HTML views, PDF and ePub downloads, according to the available data) and Abstracts Views on Vision4Press platform.
Data correspond to usage on the plateform after 2015. The current usage metrics is available 48-96 hours after online publication and is updated daily on week days.
Initial download of the metrics may take a while.