Fig. 14.
Download original image
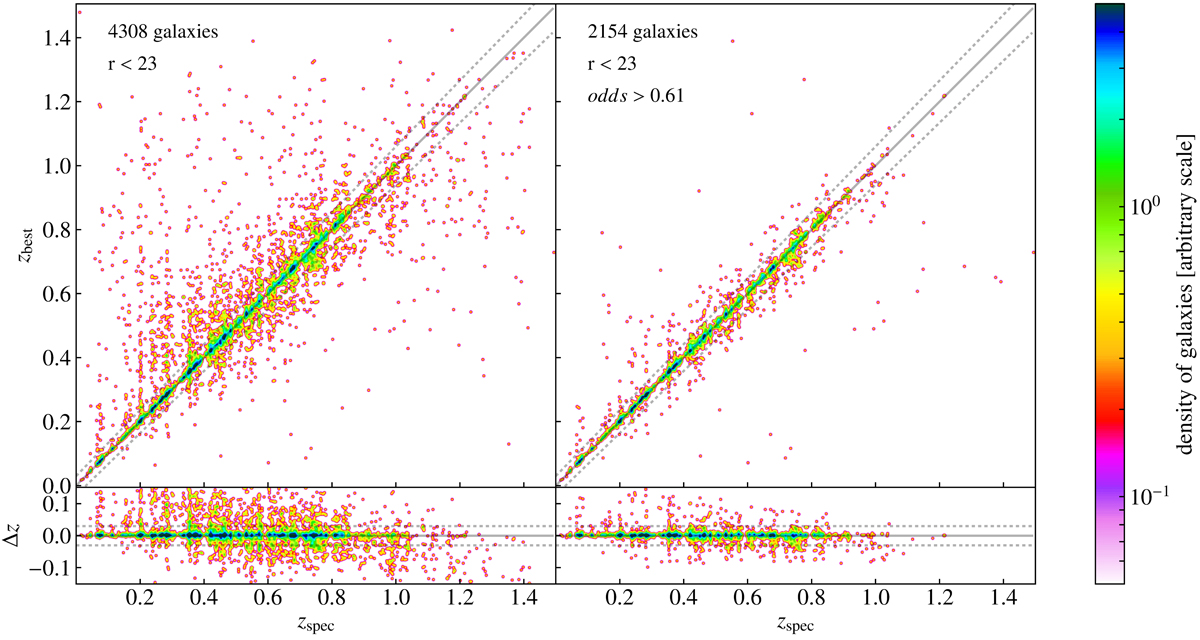
Comparison between photometric and spectroscopic redshifts for individual miniJPAS galaxies in the spectroscopic sample. The left panel includes all r < 23 galaxies with valid photo-z estimates, and the right panel contains only half the sample (those with higher odds). The bottom panels show the redshift errors, Δz. A 2D Gaussian smoothing is applied to the data to improve the visualisation of the density of points. The solid line marks the zbest = zspec relation, and the dotted lines indicate the |Δz| = 0.03 threshold we used to define outliers.
Current usage metrics show cumulative count of Article Views (full-text article views including HTML views, PDF and ePub downloads, according to the available data) and Abstracts Views on Vision4Press platform.
Data correspond to usage on the plateform after 2015. The current usage metrics is available 48-96 hours after online publication and is updated daily on week days.
Initial download of the metrics may take a while.