Free Access
Fig. 1.
Download original image
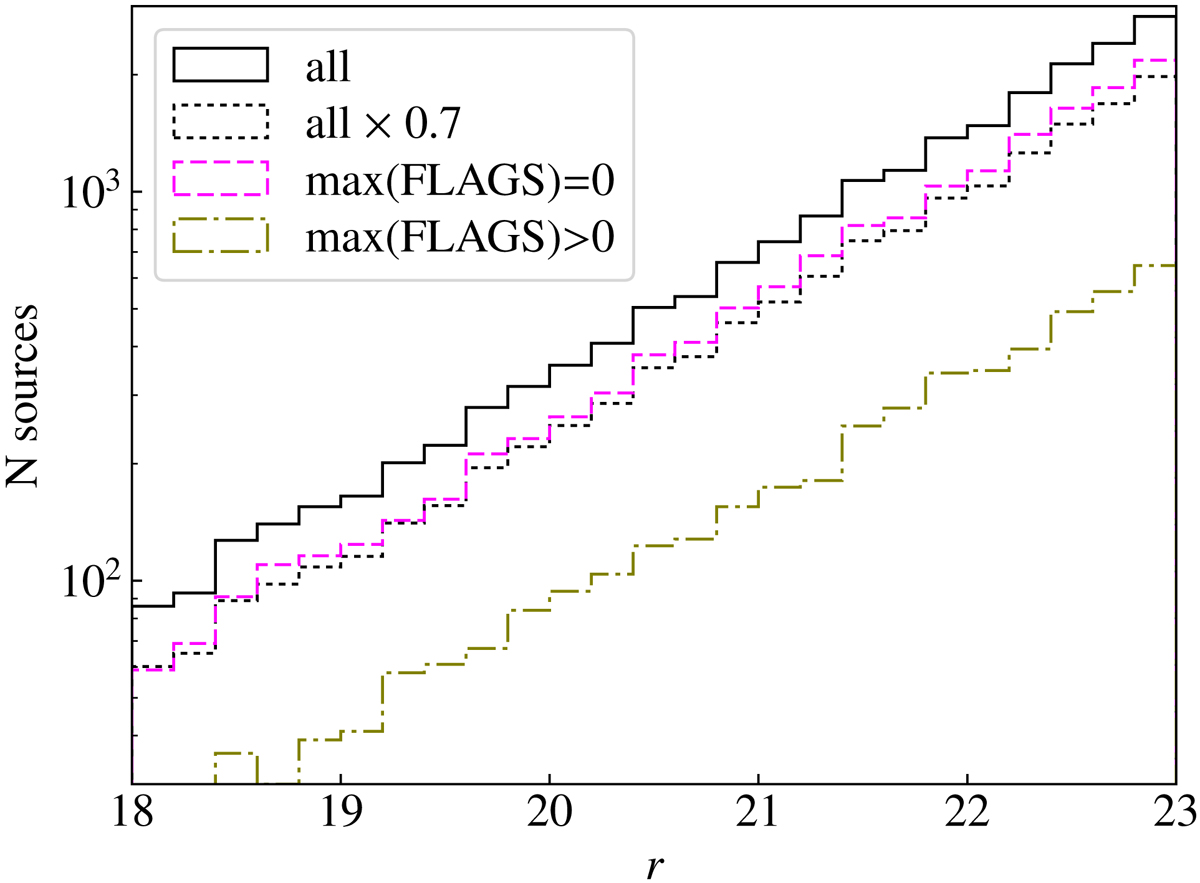
Distribution of r-band magnitudes for the whole miniJPAS sample (solid black line), flagged sources (dot-dashed olive line), and non-flagged sources (dashed magenta line). The distribution for the whole sample scaled by a factor 0.7 is shown for reference (dotted black line).
Current usage metrics show cumulative count of Article Views (full-text article views including HTML views, PDF and ePub downloads, according to the available data) and Abstracts Views on Vision4Press platform.
Data correspond to usage on the plateform after 2015. The current usage metrics is available 48-96 hours after online publication and is updated daily on week days.
Initial download of the metrics may take a while.