Fig. 7.
Download original image
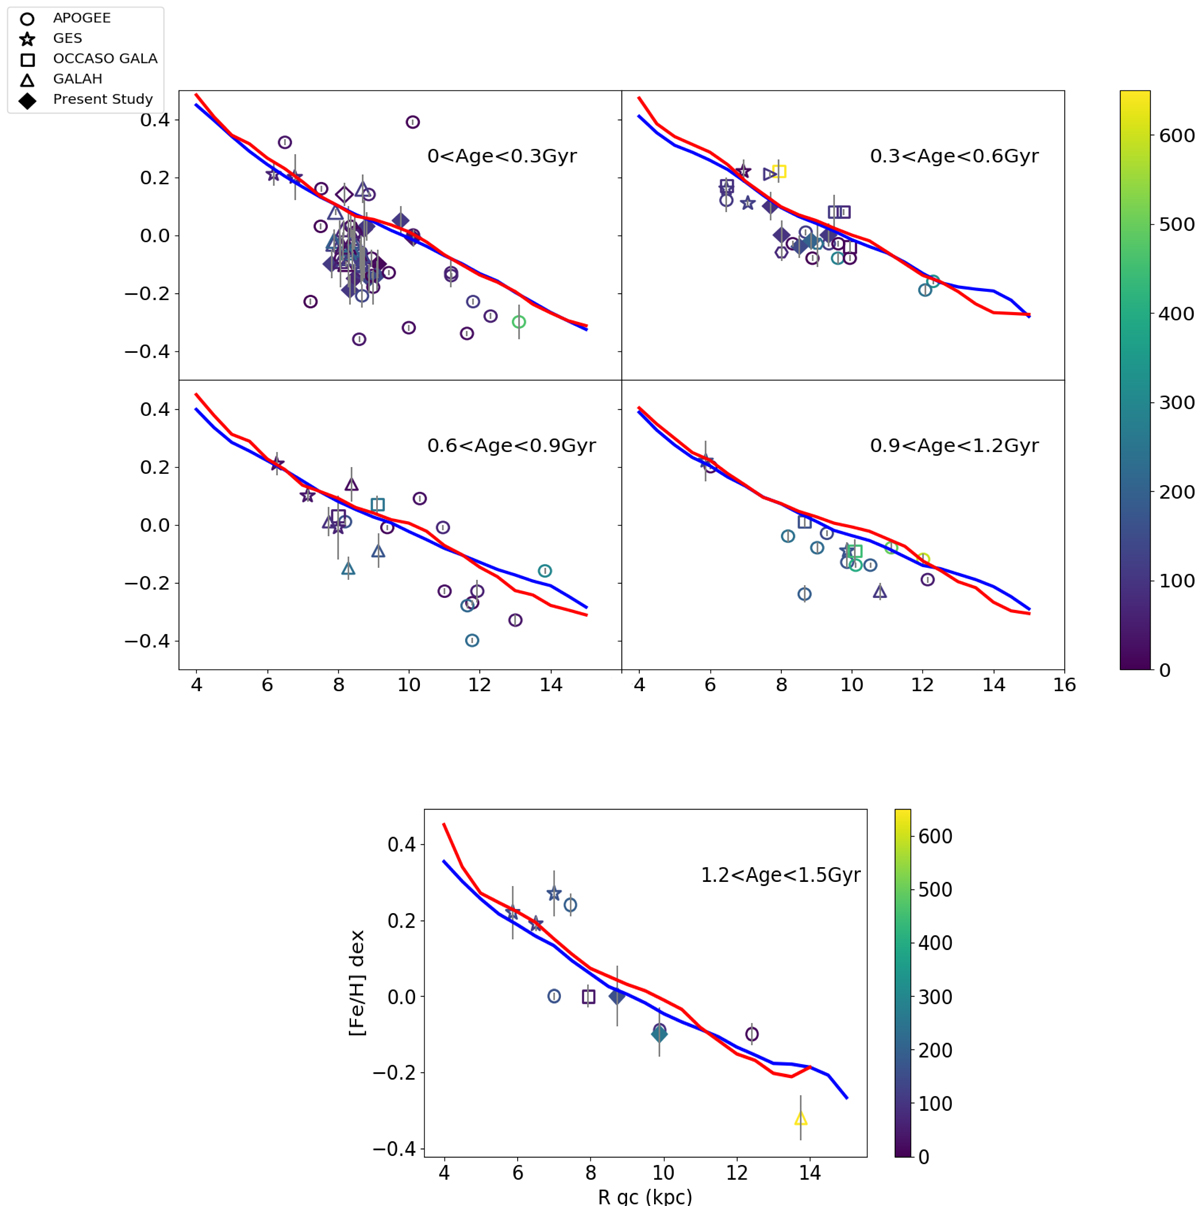
Comparison between model predictions (Minchev et al. 2014a,b) and observations for young clusters. The red and blue lines are predictions from the MCM models for |z|< 0.3 kpc and 0.3 < |z|< 0.8 kpc respectively. The colour of shading in the symbols indicates the distance from the Galactic plane. All considered clusters are within 0.6 kpc from the Galactic plane, with SPA clusters all being within 0.5 kpc. The open diamond in the first panel is ASCC 123 (Frasca et al. 2019) and the triangle symbol in the 0.3–0.6 Gyr range is NGC 2632 (D’Orazi et al. 2020) The fit is generally good for clusters older than 0.3 Gyr, but the predictions fail to reproduce the data among the very young clusters (see text).
Current usage metrics show cumulative count of Article Views (full-text article views including HTML views, PDF and ePub downloads, according to the available data) and Abstracts Views on Vision4Press platform.
Data correspond to usage on the plateform after 2015. The current usage metrics is available 48-96 hours after online publication and is updated daily on week days.
Initial download of the metrics may take a while.