Fig. 3.
Download original image
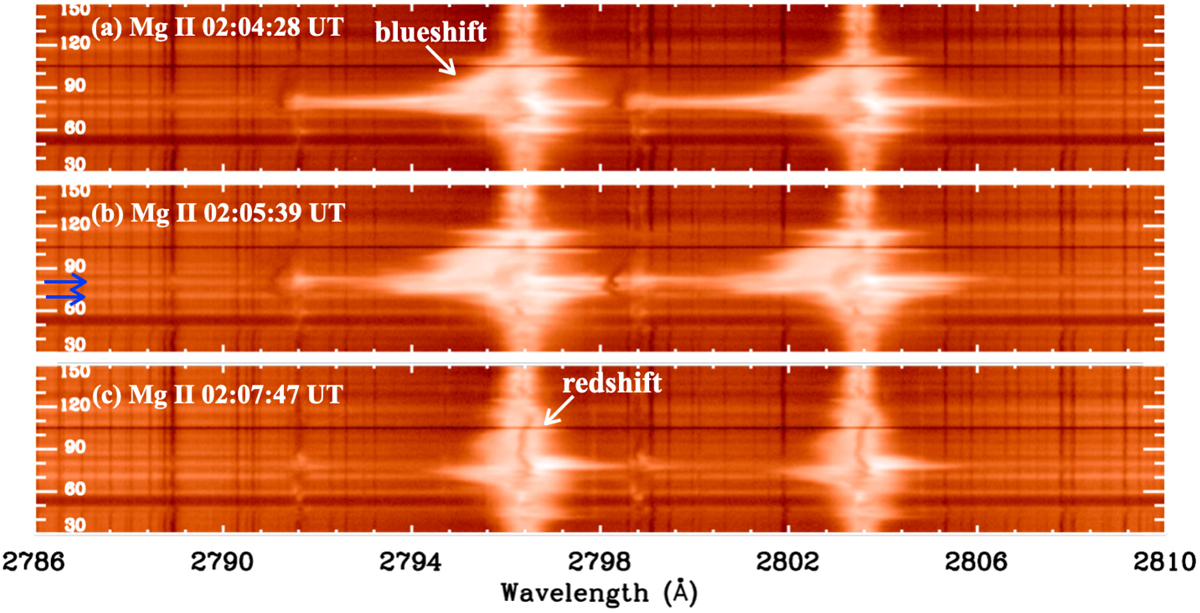
Spectra of Mg II lines h and k in the Balmer continuum full wavelength range of IRIS (50 Å) during and after the mini flare times at the reconnection site along the first slit position (Figs. 2 a–c). Bidirectional outflows are observed at the reconnection point (y = 80 in panel a). Balmer continuum emission is visible in the three panels at two different pixels (y = 70, 80) in wavelengths 10 Å far from the k line core (see in panel b the two horizontal blue arrows). Blueshifts and redshifts, indicated by two white arrows in the Mg II k line wings, correspond to the twisted expelled jet and material falling back (panels a and c).
Current usage metrics show cumulative count of Article Views (full-text article views including HTML views, PDF and ePub downloads, according to the available data) and Abstracts Views on Vision4Press platform.
Data correspond to usage on the plateform after 2015. The current usage metrics is available 48-96 hours after online publication and is updated daily on week days.
Initial download of the metrics may take a while.