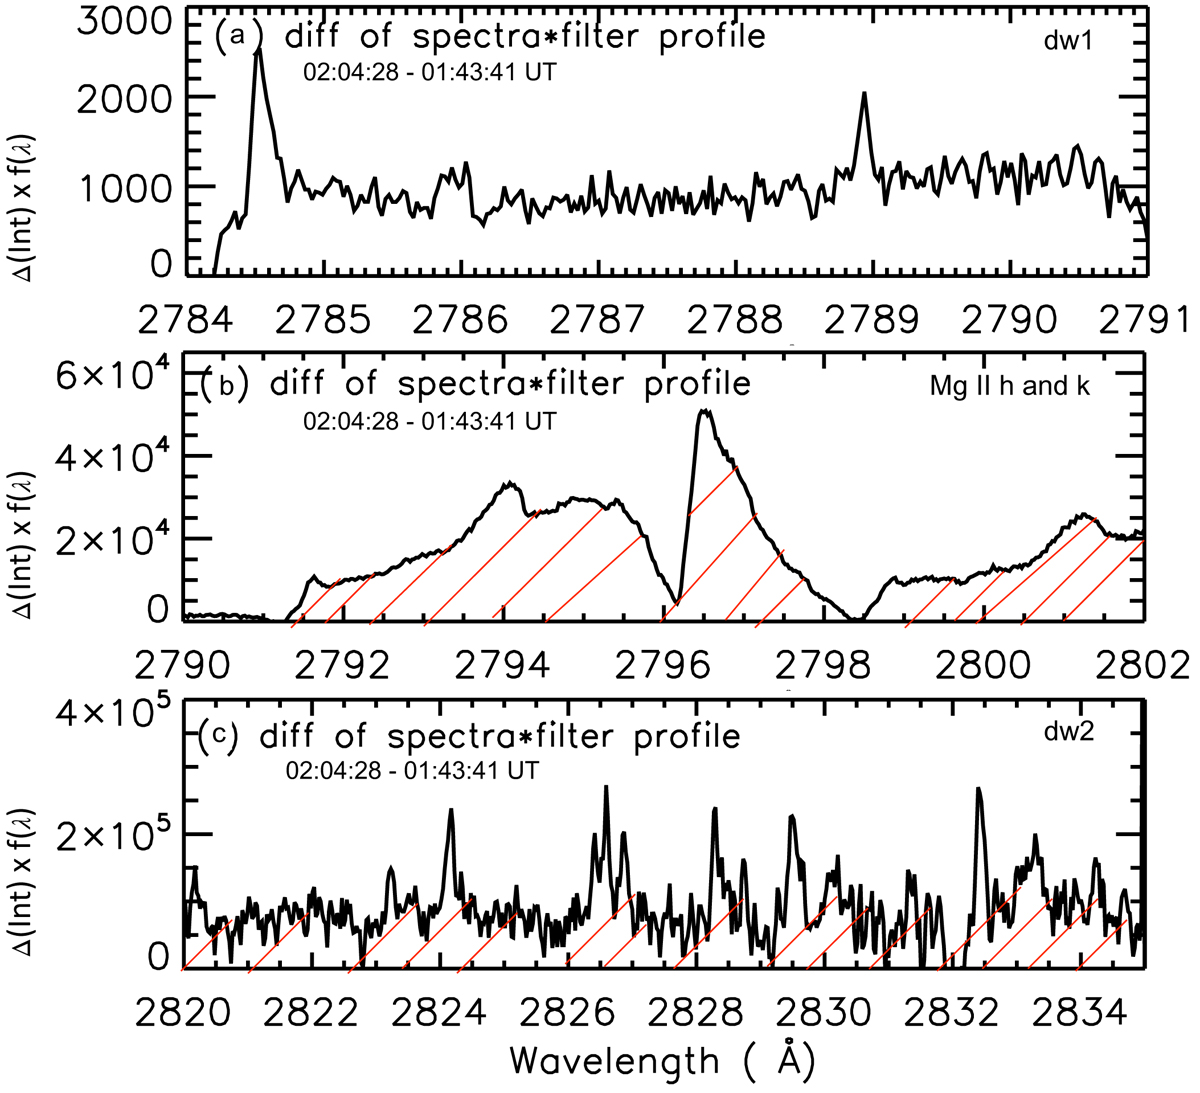
Fig. 10.
Download original image
Variation with wavelength of the difference of intensity between flare and preflare times in three wavelength ranges containing continuum regions (dw1 and dw2) and the Mg II h & k line. The differences in intensity have been multiplied by the transmission filter profile f(λ) of the 2832 Å filter (Kleint et al. 2017). After normalization of the hatched areas in panelsb and c, we estimate that the contribution of the excess of the Balmer emission is 82% compared to the contribution of the Mg II k line around 18% in the wavelength domain of the 2832 Å SJI during the flare.
Current usage metrics show cumulative count of Article Views (full-text article views including HTML views, PDF and ePub downloads, according to the available data) and Abstracts Views on Vision4Press platform.
Data correspond to usage on the plateform after 2015. The current usage metrics is available 48-96 hours after online publication and is updated daily on week days.
Initial download of the metrics may take a while.