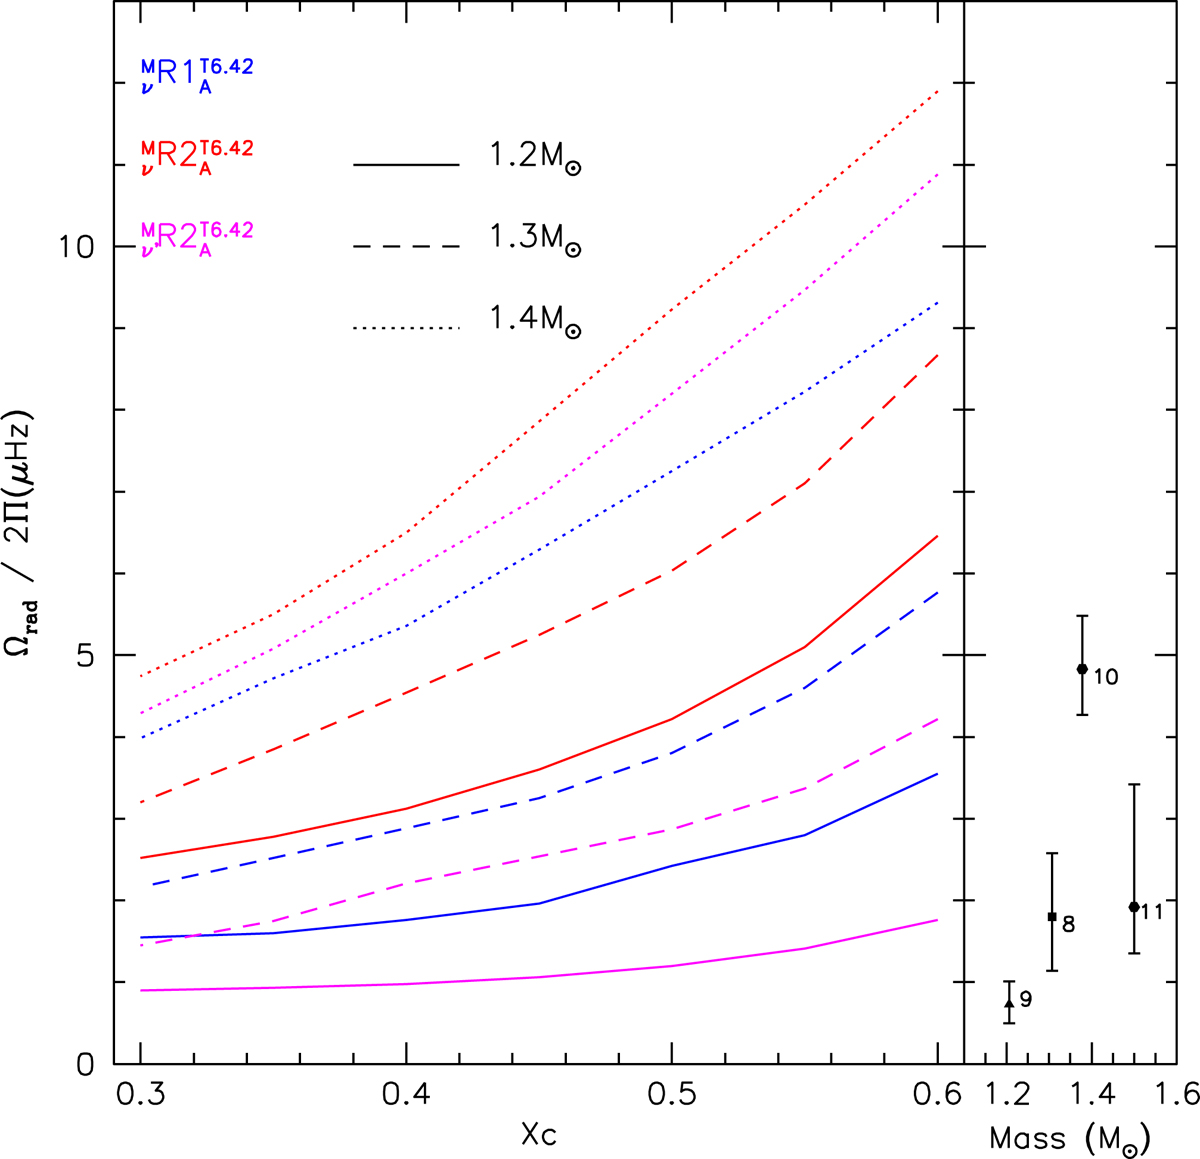
Fig. 8.
Download original image
Left: mean angular velocity within the stellar layers in the radiative zone as a function of the remaining central hydrogen mass fraction Xc (time increases from right to left) for the same models as in Fig. 7. Masses 1.2, 1.3, and 1.4 M⊙ are represented by full, dashed, and dotted lines respectively. Right: stars observed by Benomar et al. (2015) as indexed in the original paper (8: M = 1.307 ± 0.027 M⊙, 9: M = 1.206 ± 0.077 M⊙, 10: M = 1.378 ± 0.028 M⊙, and 11: 1.500 ± 0.050 M⊙).
Current usage metrics show cumulative count of Article Views (full-text article views including HTML views, PDF and ePub downloads, according to the available data) and Abstracts Views on Vision4Press platform.
Data correspond to usage on the plateform after 2015. The current usage metrics is available 48-96 hours after online publication and is updated daily on week days.
Initial download of the metrics may take a while.