Fig. 3.
Download original image
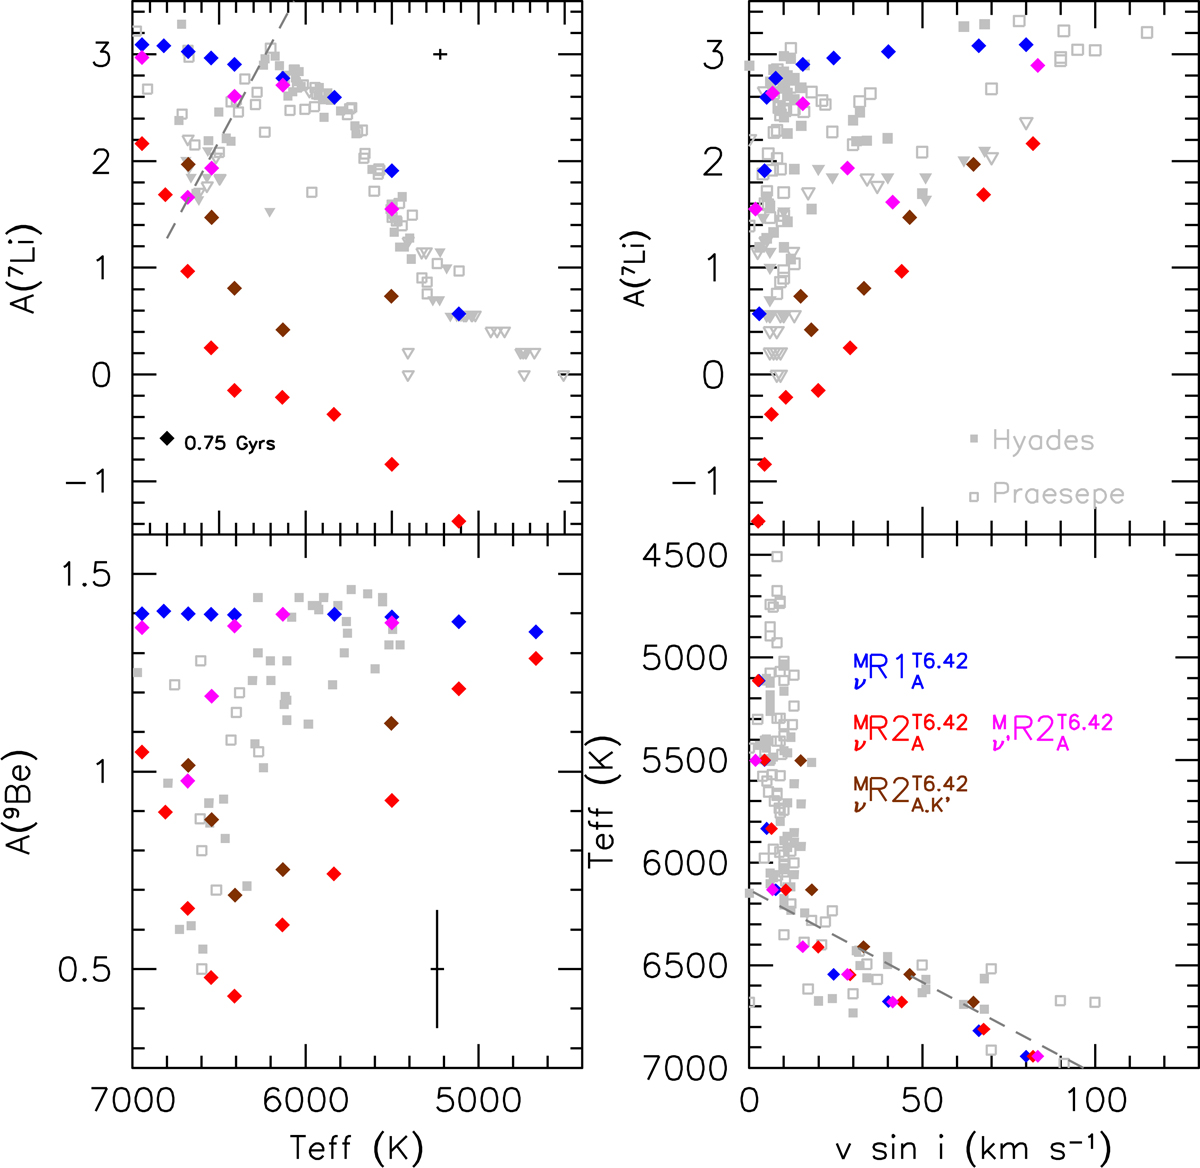
Comparison of the Li, Be, and V sin i observations in the Hyades and Praesepe (filled and open grey squares, respectively; triangles are for abundance upper limits; see Table 1 for references) with the predictions of models ![]() (blue diamonds) and
(blue diamonds) and ![]() for different values of
for different values of ![]() and K (colour-coded, see also Table 3). Model predictions are shown at 0.75 Gyr. The grey dashed line represents the empirical relation in the cold edge of the dip obtained by Cummings et al. (2017).
and K (colour-coded, see also Table 3). Model predictions are shown at 0.75 Gyr. The grey dashed line represents the empirical relation in the cold edge of the dip obtained by Cummings et al. (2017).
Current usage metrics show cumulative count of Article Views (full-text article views including HTML views, PDF and ePub downloads, according to the available data) and Abstracts Views on Vision4Press platform.
Data correspond to usage on the plateform after 2015. The current usage metrics is available 48-96 hours after online publication and is updated daily on week days.
Initial download of the metrics may take a while.