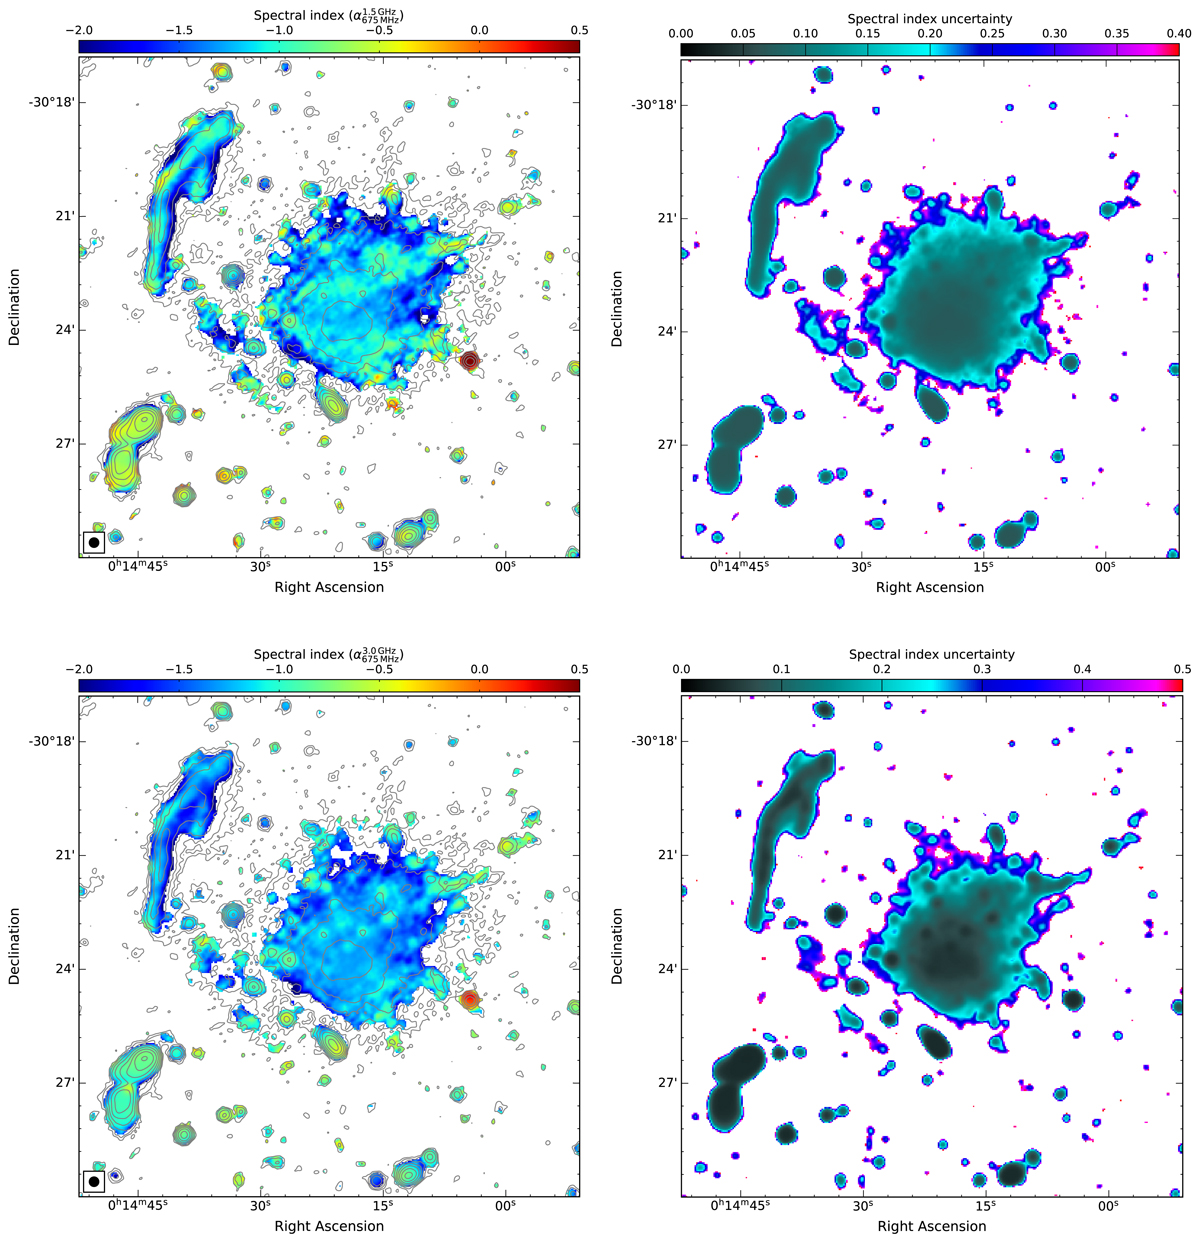
Fig. 9.
Download original image
Left: spectral index maps of the halo between 675 MHz and 1.5 GHz (top) and 675 MHz and 3.0 GHz (bottom) at 15″ resolution. The image properties are given in Table 2, IM3, IM7, and IM13. Contour levels are drawn at [1, 2, 4, 8, …] × 3.5 σrms, and are from the uGMRT Band 4 image. These maps show the presence of steeper spectral indices in outermost regions of the halo, in particular to the north. Right: corresponding spectral index uncertainty.
Current usage metrics show cumulative count of Article Views (full-text article views including HTML views, PDF and ePub downloads, according to the available data) and Abstracts Views on Vision4Press platform.
Data correspond to usage on the plateform after 2015. The current usage metrics is available 48-96 hours after online publication and is updated daily on week days.
Initial download of the metrics may take a while.