Fig. 7.
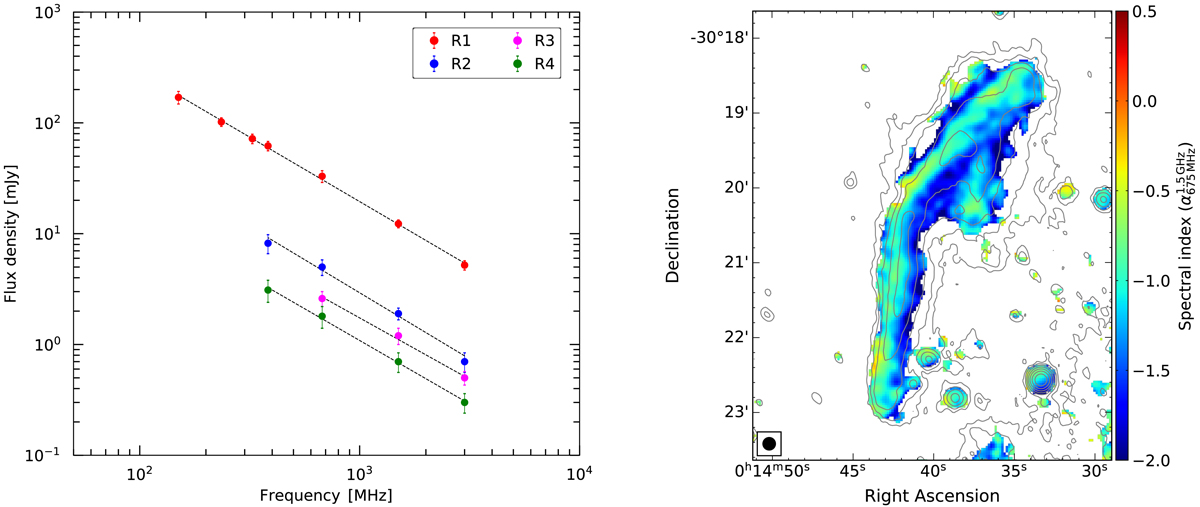
Download original image
Left: integrated radio spectra of relics R1, R2, R3, and R4. Dashed lines are the fitted power-law with indices given in Table 3. Regions used to obtained the integrated flux densities of all four relics are shown in the right panel of Fig. 7. Right: spectral index map of the main relic R1 between 675 MHz and 1.5 GHz at 10″ resolution (corresponding to IM6 and IM11 in Table 2), showing a clear spectral index gradient across the entire relic. Contour levels are drawn at [1, 2, 4, 8, …] × 3.5 σrms, and are from the uGMRT Band 4 image.
Current usage metrics show cumulative count of Article Views (full-text article views including HTML views, PDF and ePub downloads, according to the available data) and Abstracts Views on Vision4Press platform.
Data correspond to usage on the plateform after 2015. The current usage metrics is available 48-96 hours after online publication and is updated daily on week days.
Initial download of the metrics may take a while.