Fig. 6.
Download original image
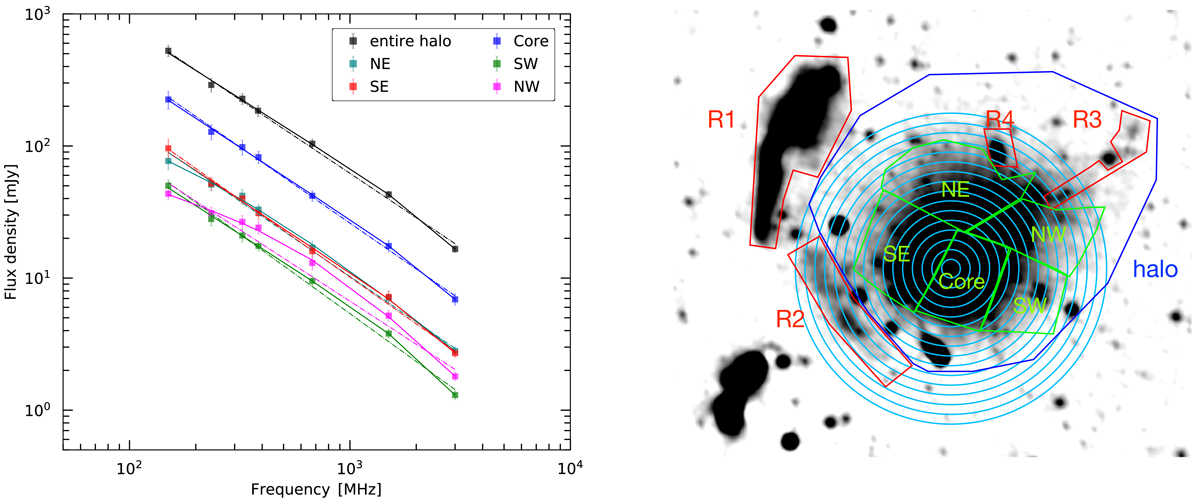
Left: integrated radio spectra of the entire halo and its subregions. The solid and dash-dotted lines show fitted power-law and double power-law spectra, respectively. The radio spectrum of the halo is described by a power-law between 150 MHz and 3 GHz. Unlike the entire halo, its subregions show different spectra also featuring high frequency spectral steepening. Right: flux density of the entire halo was extracted from the blue region, labeled as halo. Green regions were used to extract the flux density from the halo subregions. The blue annuli are used to compute the radio and X-ray surface brightness profiles. These annuli have widths of 15″, similar to the radio beam size.
Current usage metrics show cumulative count of Article Views (full-text article views including HTML views, PDF and ePub downloads, according to the available data) and Abstracts Views on Vision4Press platform.
Data correspond to usage on the plateform after 2015. The current usage metrics is available 48-96 hours after online publication and is updated daily on week days.
Initial download of the metrics may take a while.