Fig. 4.
Download original image
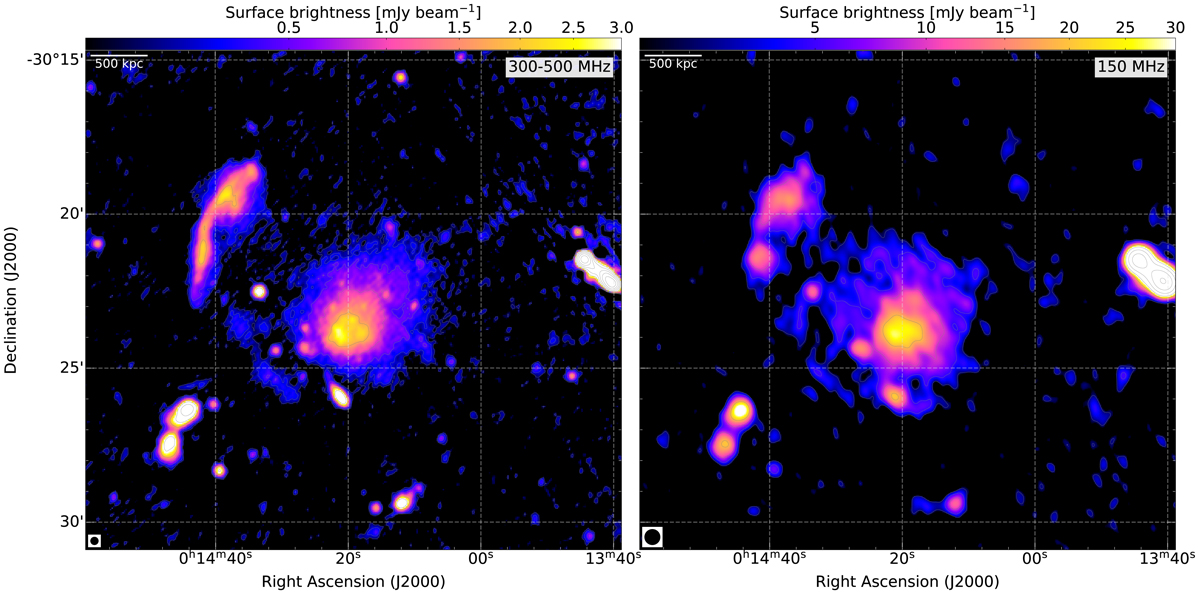
uGMRT Band 3 (left) image at 15″ resolution and GMRT 150 MHz (right) narrow band image at 30″ resolution. The image properties are given in Table 2, IM16 (left-panel) and IM21 (right-panel). Contour levels are drawn at [1, 2, 4, 8, …] × 3.5 σrms. In both images there is no region below −3.0 σrms. The halo and the main relic R1 are recovered well at both frequencies. Images are created with Briggs weighting with robust = 0. The beam size is indicated in the bottom left corner of the each image.
Current usage metrics show cumulative count of Article Views (full-text article views including HTML views, PDF and ePub downloads, according to the available data) and Abstracts Views on Vision4Press platform.
Data correspond to usage on the plateform after 2015. The current usage metrics is available 48-96 hours after online publication and is updated daily on week days.
Initial download of the metrics may take a while.