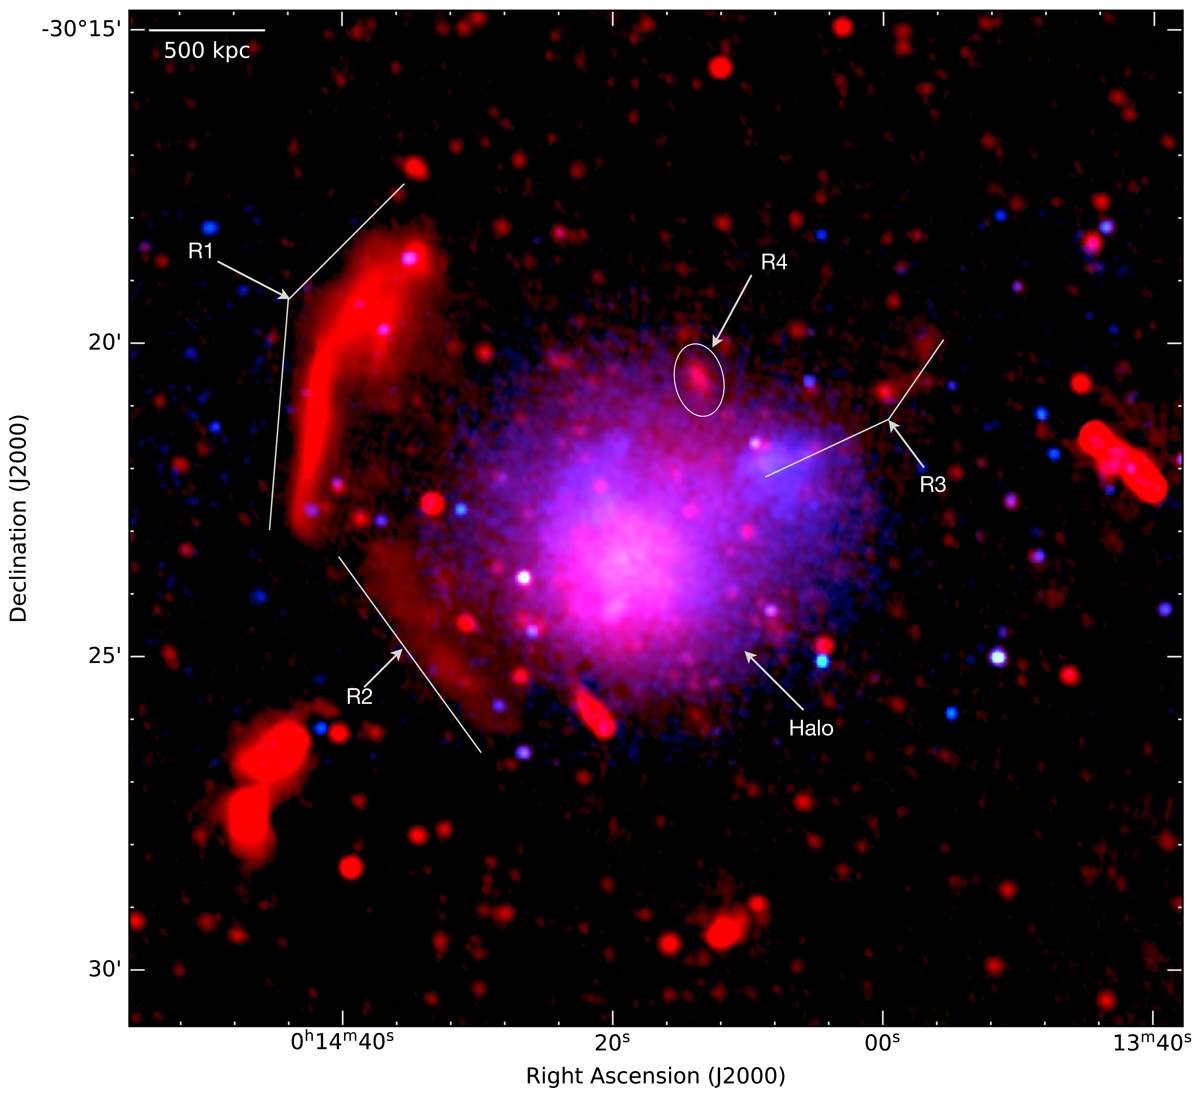
Fig. 2.
Download original image
Xray-uGMRT (550−850 MHz) overlay Abell 2744. The intensity in red shows the radio emission observed with uGMRT Band 4 at a central frequency of 675 MHz. The intensity in blue shows Chandra X-ray emission in the 0.5−2.0 keV band (Pearce et al. 2017), smoothed to 3″. The image properties are given in Table 2, IM10. The presence of four relics and the halo suggests a complex, multiple mergers.
Current usage metrics show cumulative count of Article Views (full-text article views including HTML views, PDF and ePub downloads, according to the available data) and Abstracts Views on Vision4Press platform.
Data correspond to usage on the plateform after 2015. The current usage metrics is available 48-96 hours after online publication and is updated daily on week days.
Initial download of the metrics may take a while.