Fig. 19.
Download original image
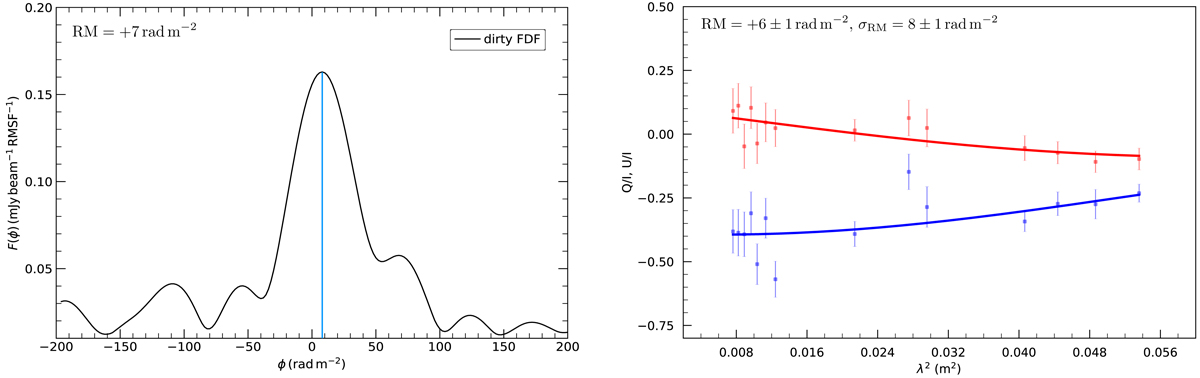
Left: Faraday spectrum of one of the regions within R1 obtained using RM-synthesis. The blue line indicates the peak RM. Right: corresponding QU-fitting spectrum fitted with a single RM component and an exponential external depolarization term. The fractional Stokes Q (blue) and U (red) with the dots showing the observed data points and the solid lines the best-fit model from the QU-fitting. Both RM-synthesis and QU-fitting spectra are consistent with a single RM component that has a low value of Faraday dispersion measure, indicating that the relic R1 is located far outside of the cluster or toward the observer.
Current usage metrics show cumulative count of Article Views (full-text article views including HTML views, PDF and ePub downloads, according to the available data) and Abstracts Views on Vision4Press platform.
Data correspond to usage on the plateform after 2015. The current usage metrics is available 48-96 hours after online publication and is updated daily on week days.
Initial download of the metrics may take a while.