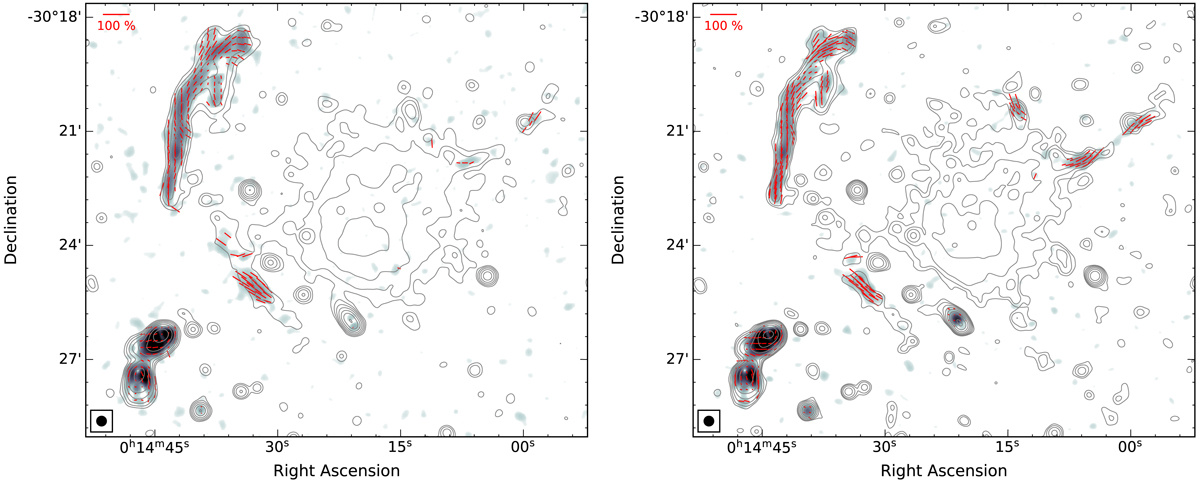
Fig. 18.
Download original image
VLA L-band (left) and S-band (right) polarization intensity maps at 15″ resolution. Red lines represent the magnetic field vectors. Their orientation represents the projected magnetic field corrected for Faraday rotation and the contribution from the Galactic foreground. For all four relics, the magnetic-field vectors are uniformly disturbed and parallel to the orientation of the radio emission. The vector lengths is proportional to the polarization percentage. No vectors were drawn for pixels below 3σ. Contour levels are drawn at [1, 2, 4, 8, …] × 5σrms and are from the Stokes I images.
Current usage metrics show cumulative count of Article Views (full-text article views including HTML views, PDF and ePub downloads, according to the available data) and Abstracts Views on Vision4Press platform.
Data correspond to usage on the plateform after 2015. The current usage metrics is available 48-96 hours after online publication and is updated daily on week days.
Initial download of the metrics may take a while.