Free Access
Fig. 17.
Download original image
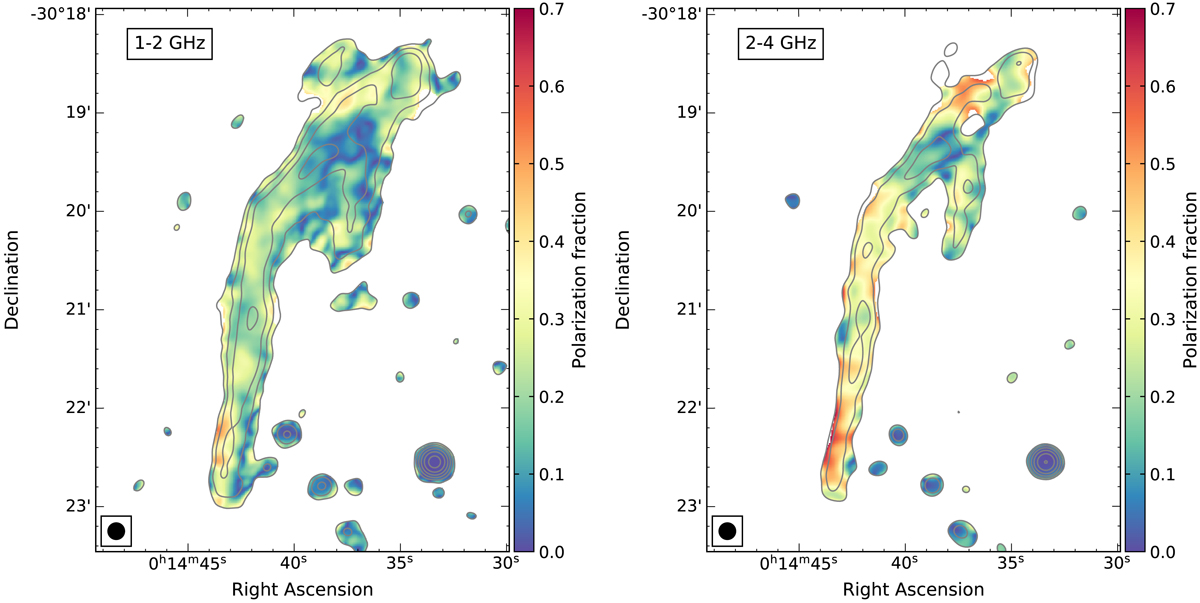
Fractional polarization maps of the main relic at 10″ resolution. The degree of polarization across the relic decreases when going from S-band (right) to L-band (left). Some local fluctuations in polarization fraction are visible, particularly in the northern part of the relic. Contour levels are same as in Fig. 16.
Current usage metrics show cumulative count of Article Views (full-text article views including HTML views, PDF and ePub downloads, according to the available data) and Abstracts Views on Vision4Press platform.
Data correspond to usage on the plateform after 2015. The current usage metrics is available 48-96 hours after online publication and is updated daily on week days.
Initial download of the metrics may take a while.