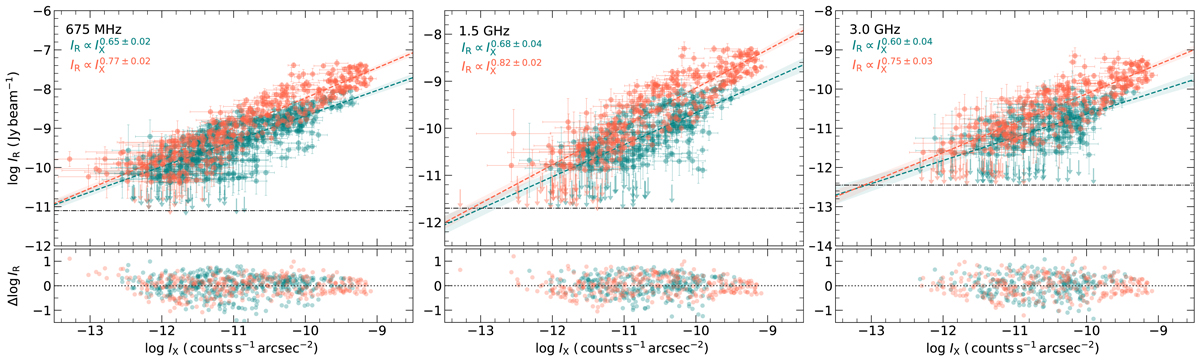
Fig. 14.
Download original image
Left: IR − IX relation for the northern (turquoise) and southern (orange) parts of the halo. The upper limits (arrows) represent cells with data points below 2σ radio noise level. The horizontal black dash-dotted lines indicate the 1σ in the radio maps. The turquoise and orange dashed lines correspond to the best-fit obtained separately for the northern and southern, respectively, parts of the halo. The best-fits are reported with the corresponding 95% confidence regions. The correlation slope is indeed different for the northern and southern regions of the halo: the southern part of the halo is steeper than the northern part at all three frequencies.
Current usage metrics show cumulative count of Article Views (full-text article views including HTML views, PDF and ePub downloads, according to the available data) and Abstracts Views on Vision4Press platform.
Data correspond to usage on the plateform after 2015. The current usage metrics is available 48-96 hours after online publication and is updated daily on week days.
Initial download of the metrics may take a while.