Fig. 13.
Download original image
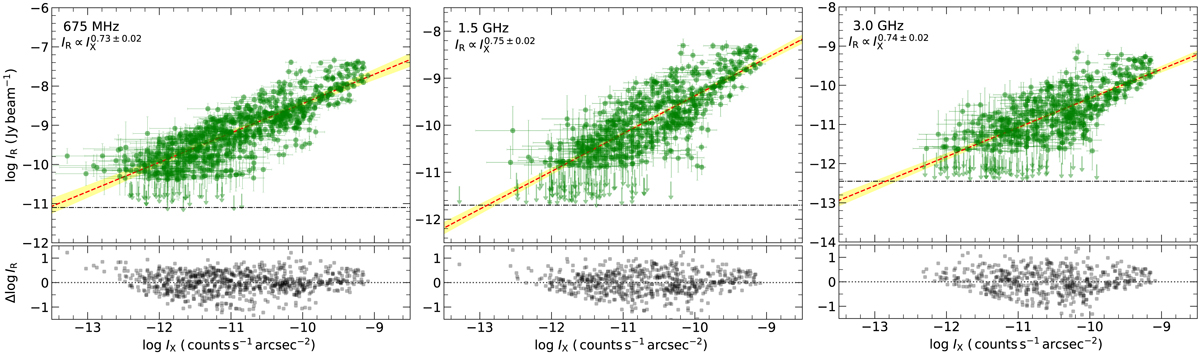
Left: IR − IX relation of the halo in Abell 2744, extracted in square boxes with width of 10″ (about 45 kpc). The X-ray surface brightness is extracted from the Chandra (0.5−2.0 keV band) image smoothed with a Gaussian FWHM of 3″. The radio surface brightness is extracted from radio maps at 10″ resolution. The Linmix best-fit relations are indicated by red dashed lines. Green circles depict cells where the radio and X-ray surface brightness is above 3σ level. The upper limits (arrows) represent cells with data points below 2σ radio noise level. The horizontal black dash-dotted lines indicate the 1σ in the radio maps. Yellow show samples from the posterior distribution. The best-fit are reported with the corresponding 95% confidence regions. Lower panel: residuals of log IR and log IX with respect to the Linmix best fit line. The radio brightness strongly correlates with the X-ray at all three frequencies. The best-fitting slopes at 675 MHz, 1.5 GHz and 3 GHz are 0.73 ± 0.02, 0.75 ± 0.02, and 0.74 ± 0.02, respectively.
Current usage metrics show cumulative count of Article Views (full-text article views including HTML views, PDF and ePub downloads, according to the available data) and Abstracts Views on Vision4Press platform.
Data correspond to usage on the plateform after 2015. The current usage metrics is available 48-96 hours after online publication and is updated daily on week days.
Initial download of the metrics may take a while.