Fig. 12.
Download original image
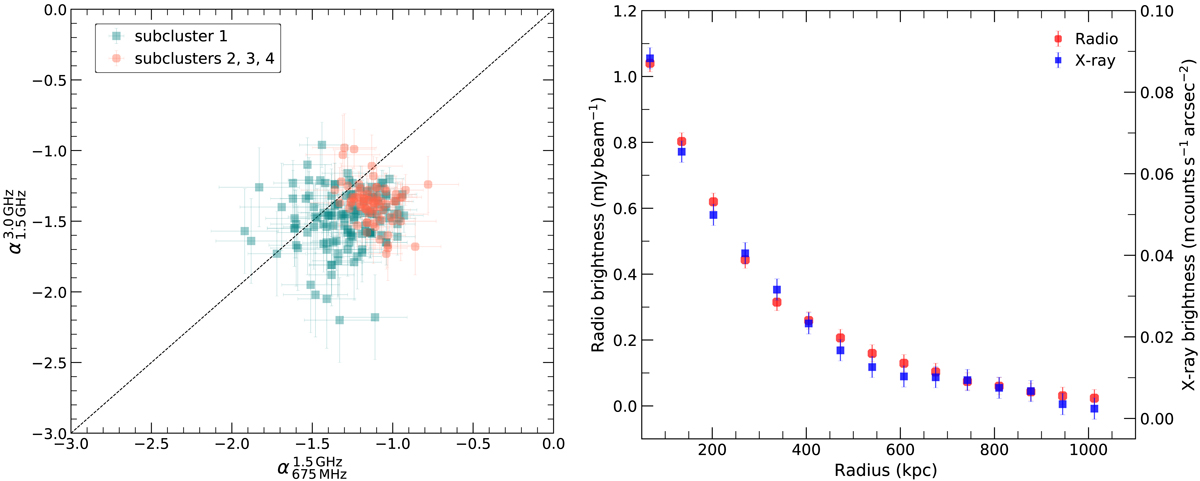
Left: radio color-color plot of the halo, showing a complex spectral curvature distribution. The orange data points are extracted from the southern part of the halo while turquoise one from the northern part. The curvature distribution is seems different in the northern and southern parts of the halo. Regions used for extracting the spectral index values are are shown in the right panel of Fig. 11. Right: comparison between the radio (red) and the X-ray (blue) surface brightness profiles for the Abell 2744 halo. The X-radio and X-ray profiles are remarkably similar.
Current usage metrics show cumulative count of Article Views (full-text article views including HTML views, PDF and ePub downloads, according to the available data) and Abstracts Views on Vision4Press platform.
Data correspond to usage on the plateform after 2015. The current usage metrics is available 48-96 hours after online publication and is updated daily on week days.
Initial download of the metrics may take a while.