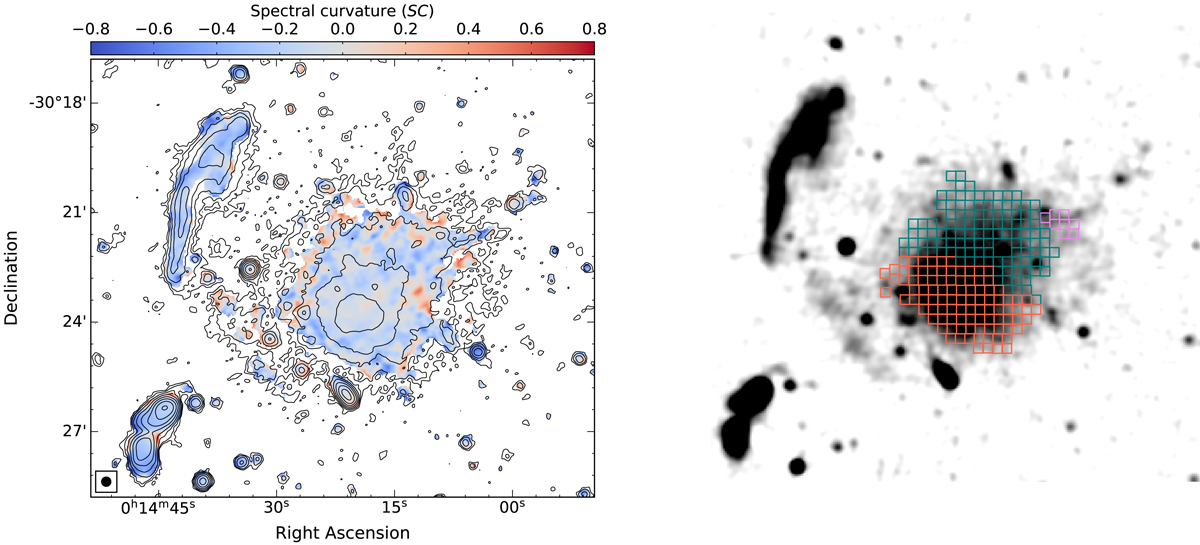
Fig. 11.
Download original image
Left: three frequency spectral curvature map of the halo at 15″ resolution, created using 675 MHz, 1.5 GHz, and 3 GHz radio maps. The image properties are given in Table 2, IM3, IM7, and IM13. The halo shows a hint of spectral curvature. The SC is negative for a convex spectrum. Contour levels are drawn at [1, 2, 4, 8, …] × 3.5 σrms, and are from the uGMRT Band 4 image. Right: regions where the radio spectral index values were extracted between 675 MHz and 3 GHz. Each box has a width of 15″ corresponding to a physical size of about 67 kpc. The same regions are used to obtained α − IX correlation in the left panel of Fig. 15.
Current usage metrics show cumulative count of Article Views (full-text article views including HTML views, PDF and ePub downloads, according to the available data) and Abstracts Views on Vision4Press platform.
Data correspond to usage on the plateform after 2015. The current usage metrics is available 48-96 hours after online publication and is updated daily on week days.
Initial download of the metrics may take a while.