Fig. 10.
Download original image
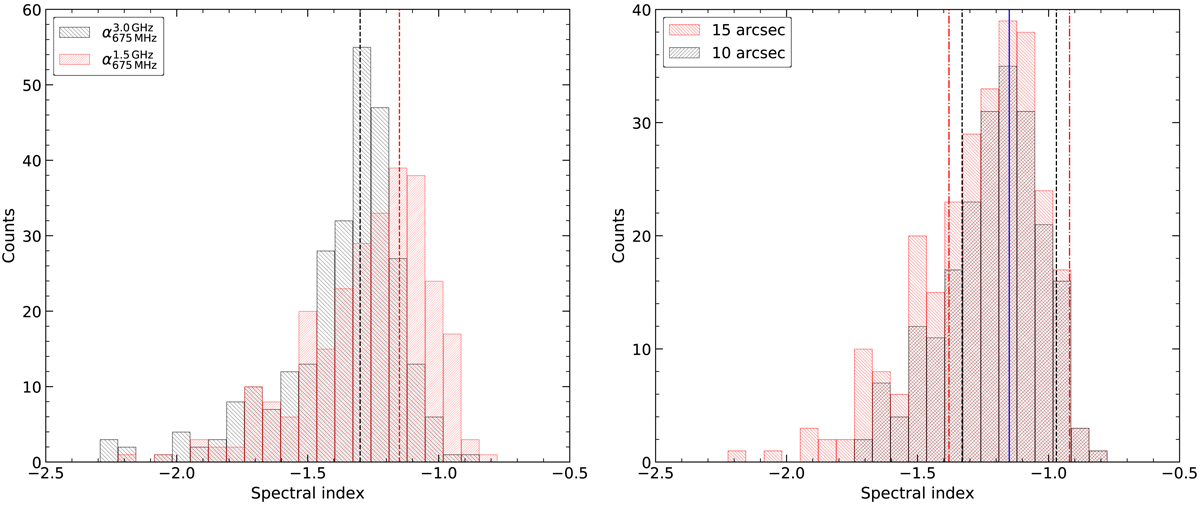
Left: histogram of the spectral index distribution across the halo in Abell 2744 for different sets of frequencies. The low frequency values were obtained between 675 MHz and 1.5 GHz (in red) while the other one between 675 MHz and 3 GHz (in black). The spectral indices were extracted from 15″ boxes, corresponding to a physical size of about 67 kpc. The dashed lines represent the median spectral index values. Right: histogram of spectral index values obtained from 10″ (black) and 15″ (red) resolution radio maps created between 675 MHz and 1.5 GHz. The plot suggest that the distribution of the mean spectral index and its standard deviation have a little impact when adopting different resolutions. The solid blue line represents the median value, ⟨α⟩= − 1.15, at both 10″ and 15″ resolution. The dash-dotted (red) and dashed (black) lines represent the standard deviation around the median values at 10″ (σ10″ = 0.19) and 15″ (σ15″ = 0.24), respectively.
Current usage metrics show cumulative count of Article Views (full-text article views including HTML views, PDF and ePub downloads, according to the available data) and Abstracts Views on Vision4Press platform.
Data correspond to usage on the plateform after 2015. The current usage metrics is available 48-96 hours after online publication and is updated daily on week days.
Initial download of the metrics may take a while.