Fig. 3.
Download original image
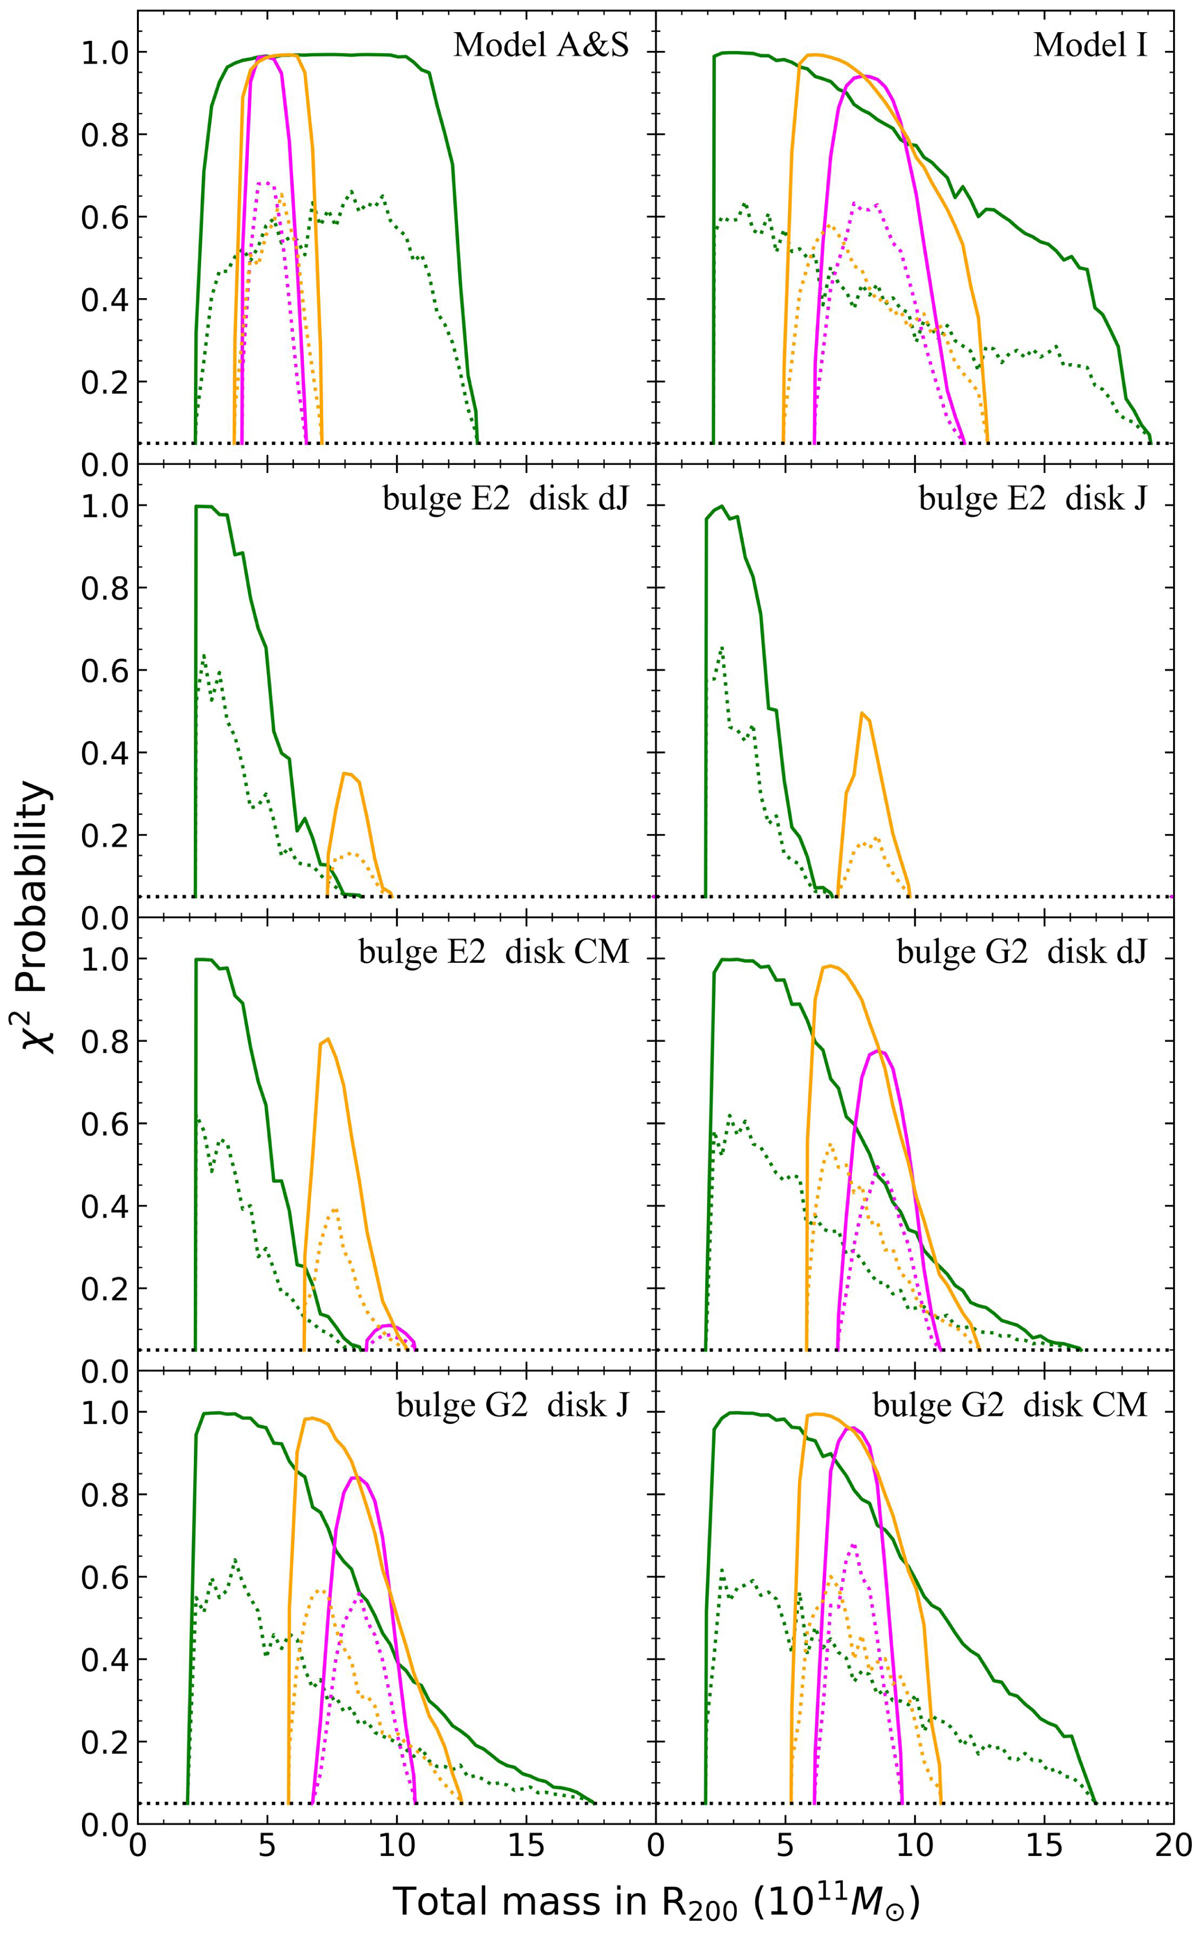
Maximum (solid lines) and averaged (dotted lines) χ2 probabilities for the different baryonic models. Model names are labeled in each panel, with Einasto, NFW, and gNFW mass predictions in green, magenta, and orange, respectively. The two panels associated with baryonic model E2+dJ and E2+J show no histogram for the NFW because this density profile fails to reproduce the MW RC. The horizontal dotted lines indicates the χ2 probability limit of 0.05 below which a model is found to be unable to fit the MW RC.
Current usage metrics show cumulative count of Article Views (full-text article views including HTML views, PDF and ePub downloads, according to the available data) and Abstracts Views on Vision4Press platform.
Data correspond to usage on the plateform after 2015. The current usage metrics is available 48-96 hours after online publication and is updated daily on week days.
Initial download of the metrics may take a while.