Fig. 4.
Download original image
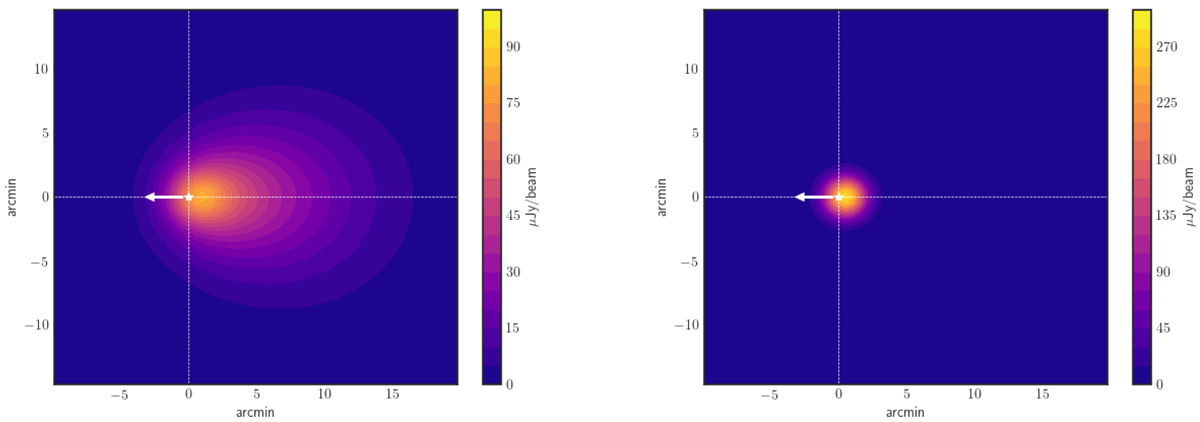
Synthetic synchrotron specific flux maps displaying the expected radio emission from IGR J11014–6103 in the 0.9–1.7 GHz band in which MeerKAT operates, convolved with an instrument beam of 15″ × 15″ (Jonas & MeerKAT Team 2016). The contribution from particles injected all along the IGR J11014–6103’s lifetime, which escaped the nebula and diffused into the ISM (BISM = 5μG), is displayed in the left panel, and that from the JET region (BISM = 30μG) is shown in the right panel. A white star indicates the position of the pulsar, which is assumed to move leftwards along the horizontal dashed-line.
Current usage metrics show cumulative count of Article Views (full-text article views including HTML views, PDF and ePub downloads, according to the available data) and Abstracts Views on Vision4Press platform.
Data correspond to usage on the plateform after 2015. The current usage metrics is available 48-96 hours after online publication and is updated daily on week days.
Initial download of the metrics may take a while.