Fig. 3.
Download original image
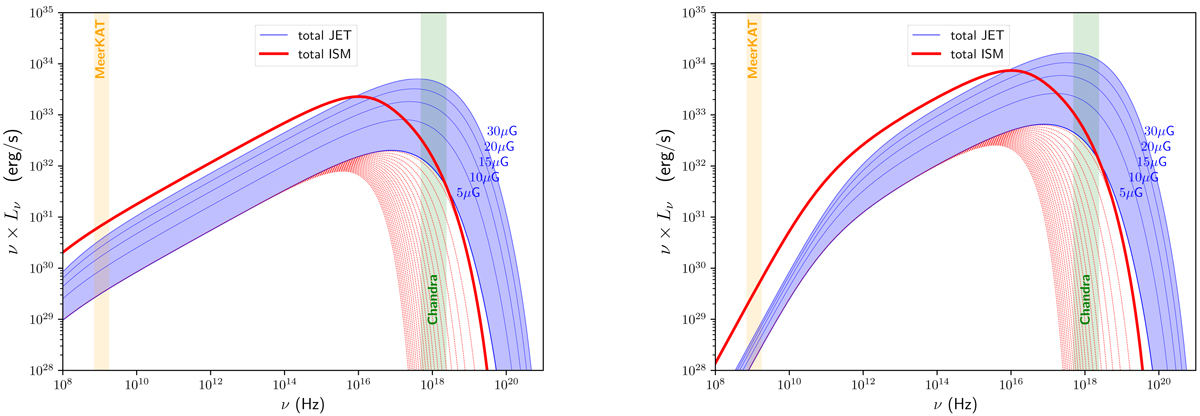
Left: spectral energy distribution of the emission produced by electrons injected in the ISM (in red) and JET regions (in blue). A magnetic field BISM = 5 μG is assumed for the ISM, whereas a range in the value of BJET = 5, 10, 15, 20 and 30 μG is probed for the JET region. Particle injection is considered up to tinj = 103 yr for the JET region and from tinj = 103 yr until tinj = 20 kyr for the ISM region (red-dotted lines). Particles are assumed to follow a power-law distribution with a low and a high energy cutoff ![]() and
and ![]() , respectively. Green and orange vertical bands denote Chandra and MeerKAT frequency coverage. Right: same as in the left panel but for a particle spectrum with a low-energy cutoff
, respectively. Green and orange vertical bands denote Chandra and MeerKAT frequency coverage. Right: same as in the left panel but for a particle spectrum with a low-energy cutoff ![]() .
.
Current usage metrics show cumulative count of Article Views (full-text article views including HTML views, PDF and ePub downloads, according to the available data) and Abstracts Views on Vision4Press platform.
Data correspond to usage on the plateform after 2015. The current usage metrics is available 48-96 hours after online publication and is updated daily on week days.
Initial download of the metrics may take a while.