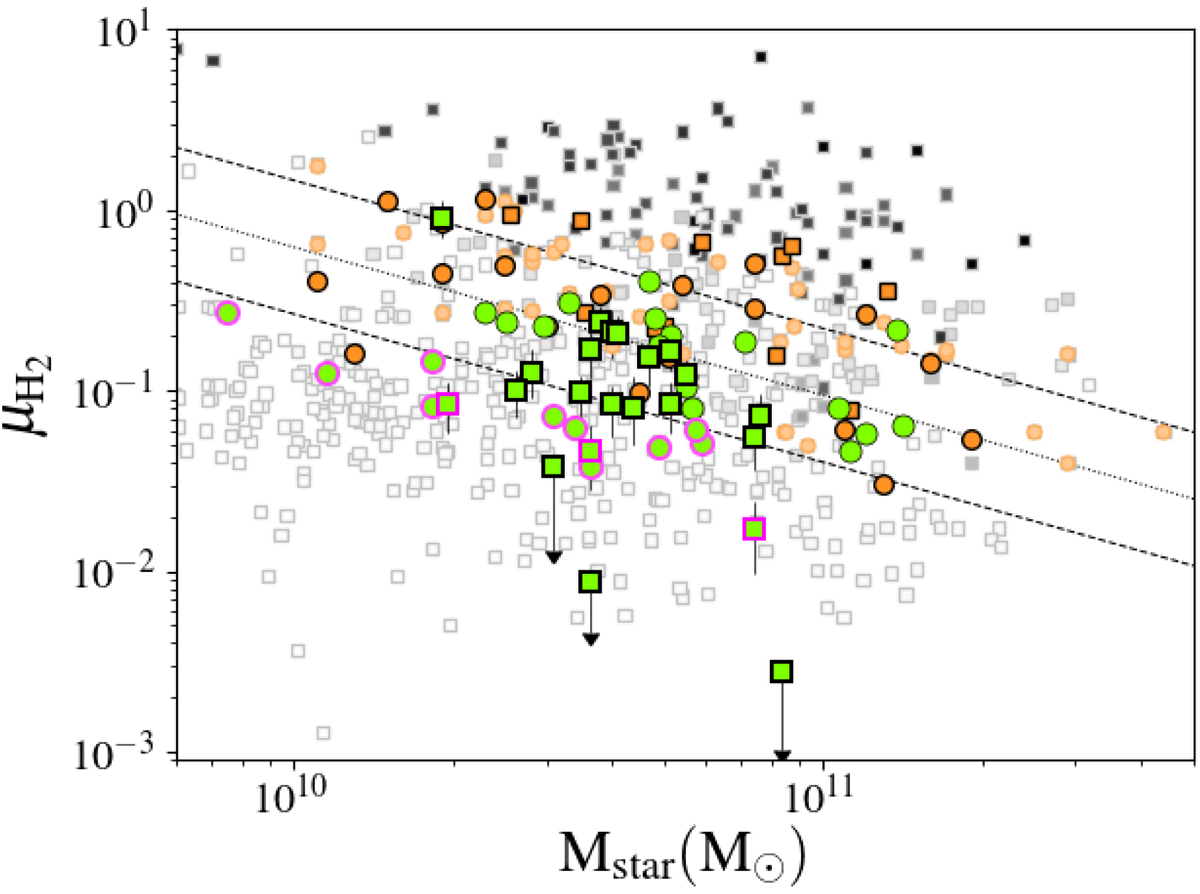
Fig. 8.
Download original image
Fraction of cold molecular gas as a function of the galaxy stellar mass. The colours and shapes of the markers are the same as in Fig. 6. The dotted line is the fit of the Mstar–μH2 relation at z ∼ 0.45 and derived from the relation for the PHIBSS2 galaxies at z ∼ 0.5, with its dispersion being represented by the two dashed lines. The pink outlined green markers are for the CL1301 low-μH2 galaxies located below the 1 × σH2 line of the Mstar–μH2 relation for the PHIBSS2 field galaxies.
Current usage metrics show cumulative count of Article Views (full-text article views including HTML views, PDF and ePub downloads, according to the available data) and Abstracts Views on Vision4Press platform.
Data correspond to usage on the plateform after 2015. The current usage metrics is available 48-96 hours after online publication and is updated daily on week days.
Initial download of the metrics may take a while.