Fig. 7.
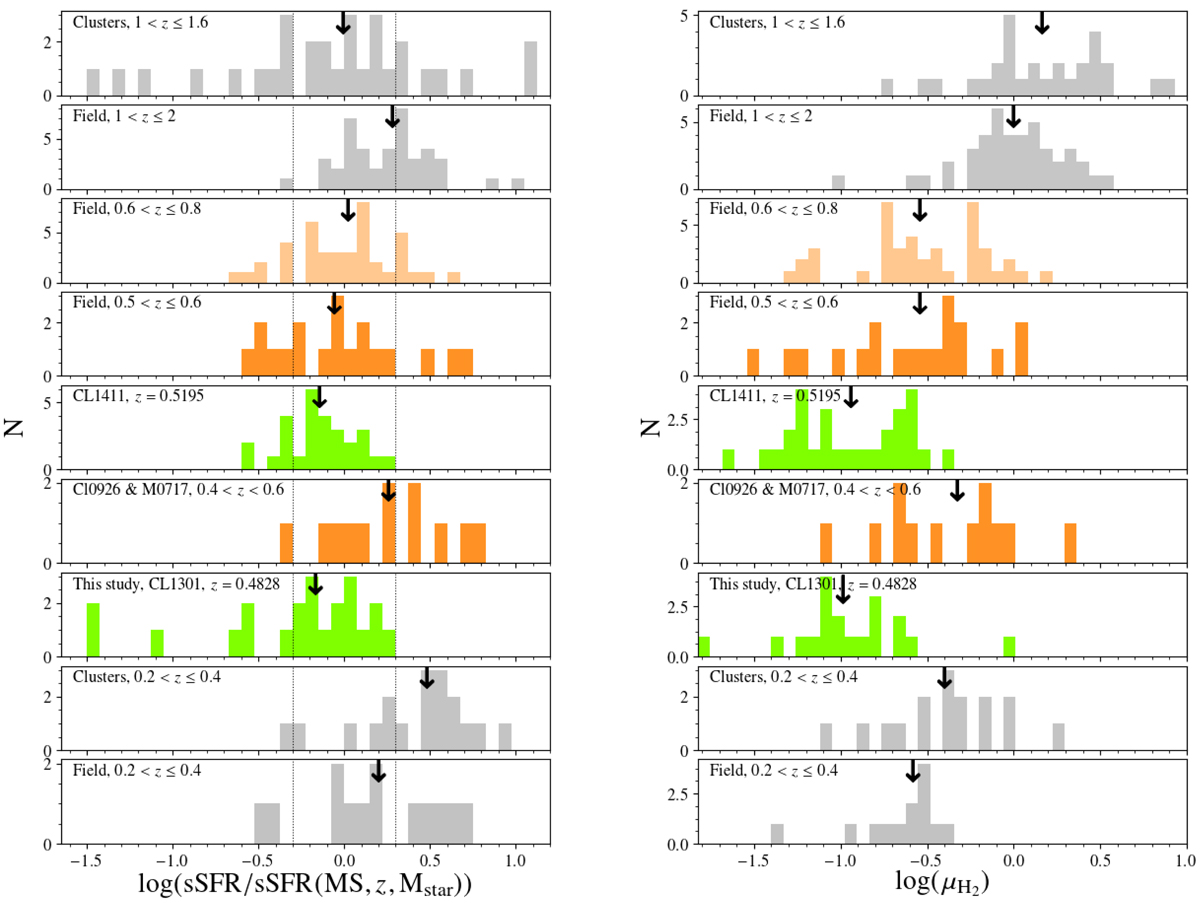
Download original image
Distribution of the sSFR normalised to the sSFR of the MS, in the left panel, and of the molecular gas-to-stellar mass ratio, μH2, in the right panel, for different redshift ranges and galaxy samples. Both of our ALMA samples CL1411.1−1148 and CL1301.7−1139 are in green. The PHIBSS2 sample, constituted of field galaxies, is divided into two redshift sub-samples, one at 0.5 ≤ z ≤ 0.6 and the other one at 0.6 < z ≤ 0.8. A sub-sample of the Castignani et al. (2020) LIRGs within clusters Cl 0926+1242 and MACS J0717.5+3745 is provided. The cluster sample at lower redshifts comprises the rest of the Castignani et al. (2020) LIRGs, as well as Geach et al. (2011) and Cybulski et al. (2016) cluster galaxies. The field samples at the bottom and top part of both panels, as well as the cluster sample on top, contain galaxies from the literature at the corresponding redshifts. The black arrows correspond to the medians of each sample. The same value of αCO has been used for all samples.
Current usage metrics show cumulative count of Article Views (full-text article views including HTML views, PDF and ePub downloads, according to the available data) and Abstracts Views on Vision4Press platform.
Data correspond to usage on the plateform after 2015. The current usage metrics is available 48-96 hours after online publication and is updated daily on week days.
Initial download of the metrics may take a while.