Fig. 5.
Download original image
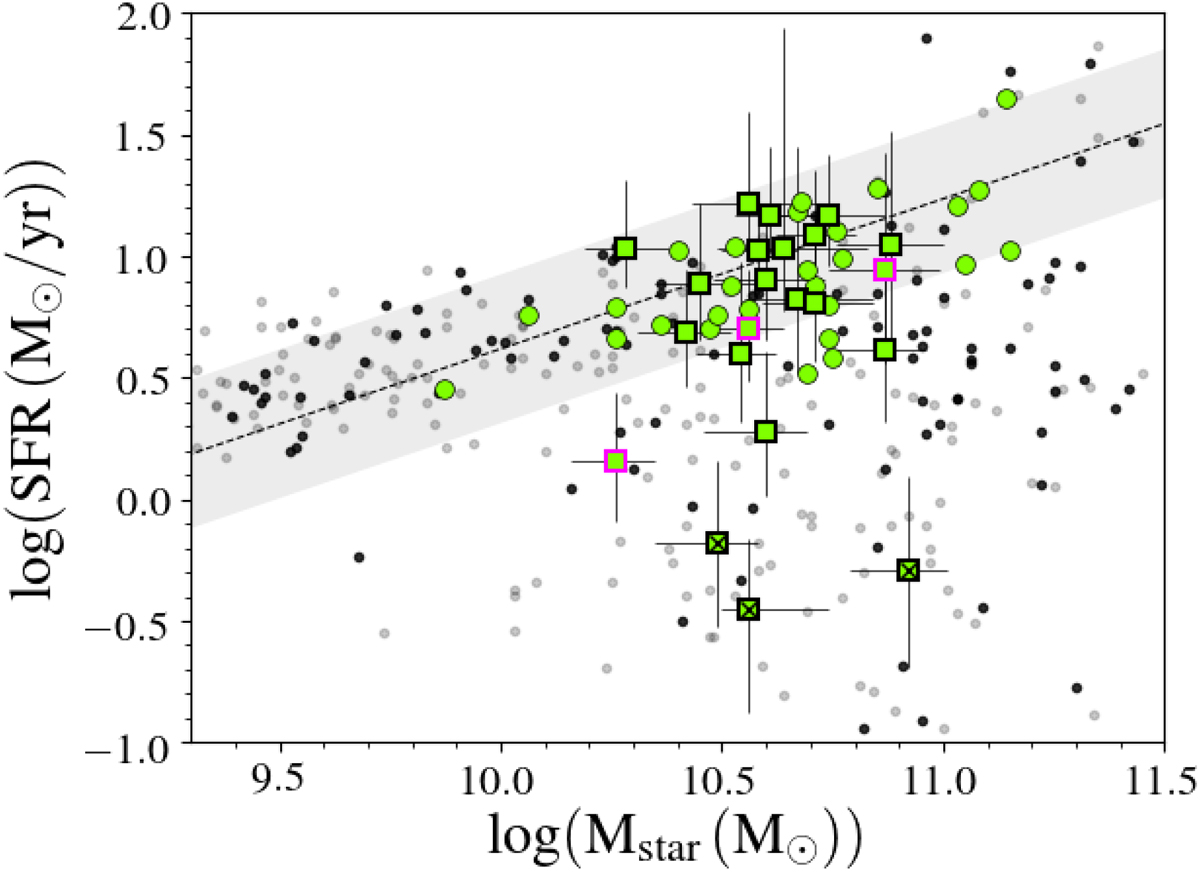
Location of the CL1301 (grey) and ALMA (green squares) galaxies in the Mstar–SFR plane. The galaxies with only upper limits in CO are identified with a cross. Squares with pink borders show the low-μH2 galaxies, see Sect. 4.1. Galaxies in black and grey are the spectroscopic and photometric samples, respectively, at the redshift of CL1301.7−1139. For comparison, the light green circles show the CL1411.1−1148 ALMA galaxies. The dashed black line is the Speagle et al. (2014) MS, corrected for a Chabrier IMF at z = 0.4828, with the corresponding ±0.3 dex scatter being the grey shaded area.
Current usage metrics show cumulative count of Article Views (full-text article views including HTML views, PDF and ePub downloads, according to the available data) and Abstracts Views on Vision4Press platform.
Data correspond to usage on the plateform after 2015. The current usage metrics is available 48-96 hours after online publication and is updated daily on week days.
Initial download of the metrics may take a while.