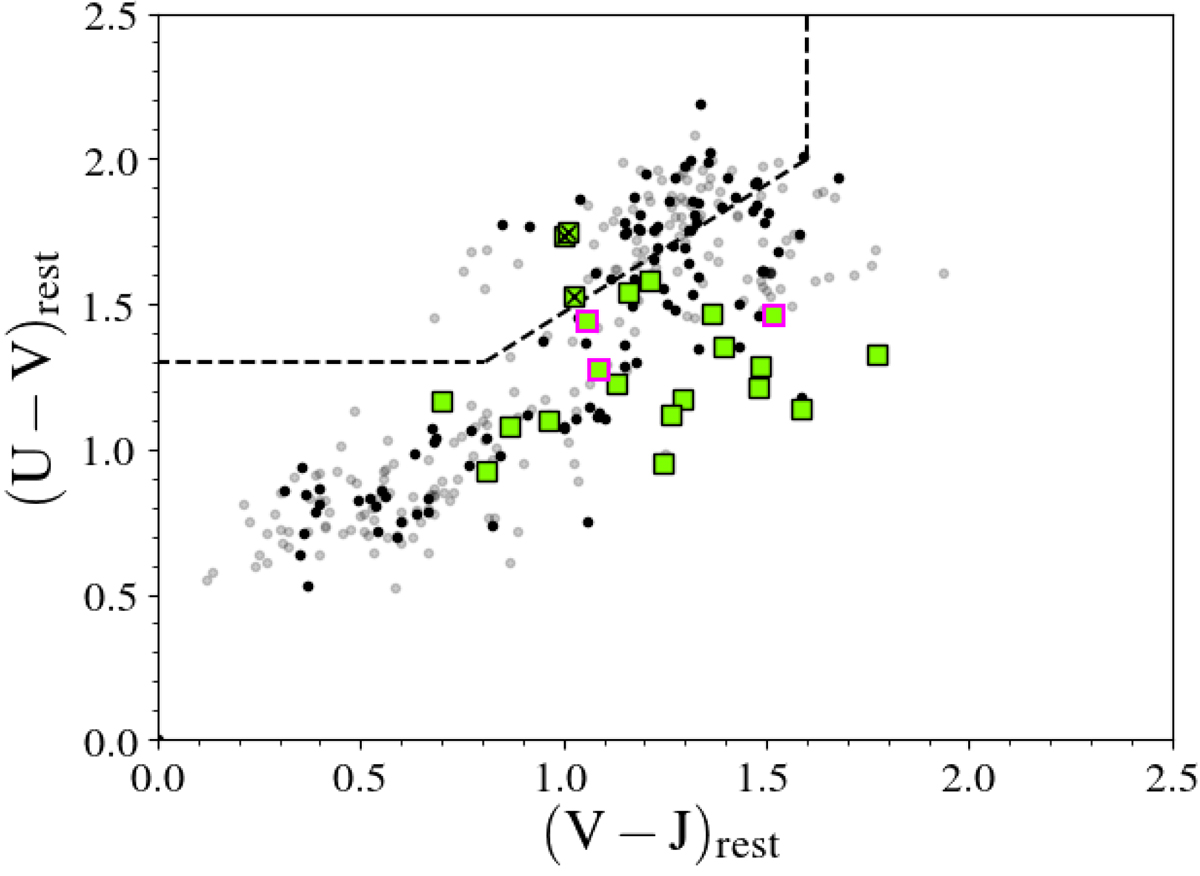
Fig. 4.
Download original image
Rest-frame UVJ colour–colour diagram. The dashed lines separate passive galaxies from star-forming ones (Williams et al. 2009). Our ALMA sample is in green. The black crosses mark the galaxies with CO upper limits. The squares with the pink borders are for our low-μH2 galaxies (see Sect. 4.1). The grey points are the photometric redshift members with a K-band detection. The small black dots are the spectroscopic redshift galaxies, within 3 × σcl of the cluster redshift, and also with a K-band detection.
Current usage metrics show cumulative count of Article Views (full-text article views including HTML views, PDF and ePub downloads, according to the available data) and Abstracts Views on Vision4Press platform.
Data correspond to usage on the plateform after 2015. The current usage metrics is available 48-96 hours after online publication and is updated daily on week days.
Initial download of the metrics may take a while.