Fig. 3.
Download original image
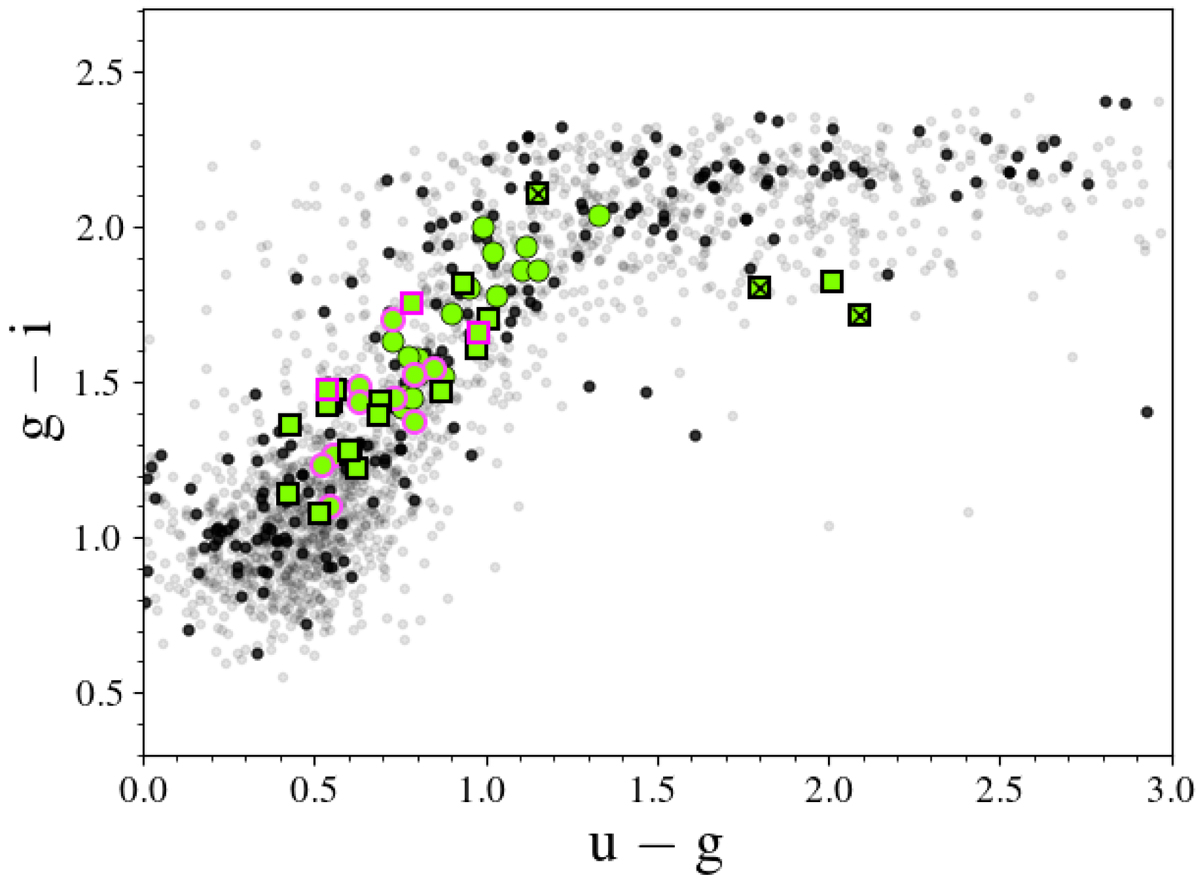
Observed colour–colour diagram, g − i as a function of u − g for the galaxies in the CL1301.7−1139 region. Our ALMA sample is shown in green, with squares for CL1301.7−1139 and with circles for CL1411.1−1148. In both cases, pink borders indicate star-forming galaxies that have low gas fractions for their stellar masses (see Sect. 4.1). The small black dots show galaxies with spectroscopic redshifts within 3 × σcl of the CL1301.7−1139 redshift. Galaxies that were not detected in CO are indicated with a cross.
Current usage metrics show cumulative count of Article Views (full-text article views including HTML views, PDF and ePub downloads, according to the available data) and Abstracts Views on Vision4Press platform.
Data correspond to usage on the plateform after 2015. The current usage metrics is available 48-96 hours after online publication and is updated daily on week days.
Initial download of the metrics may take a while.