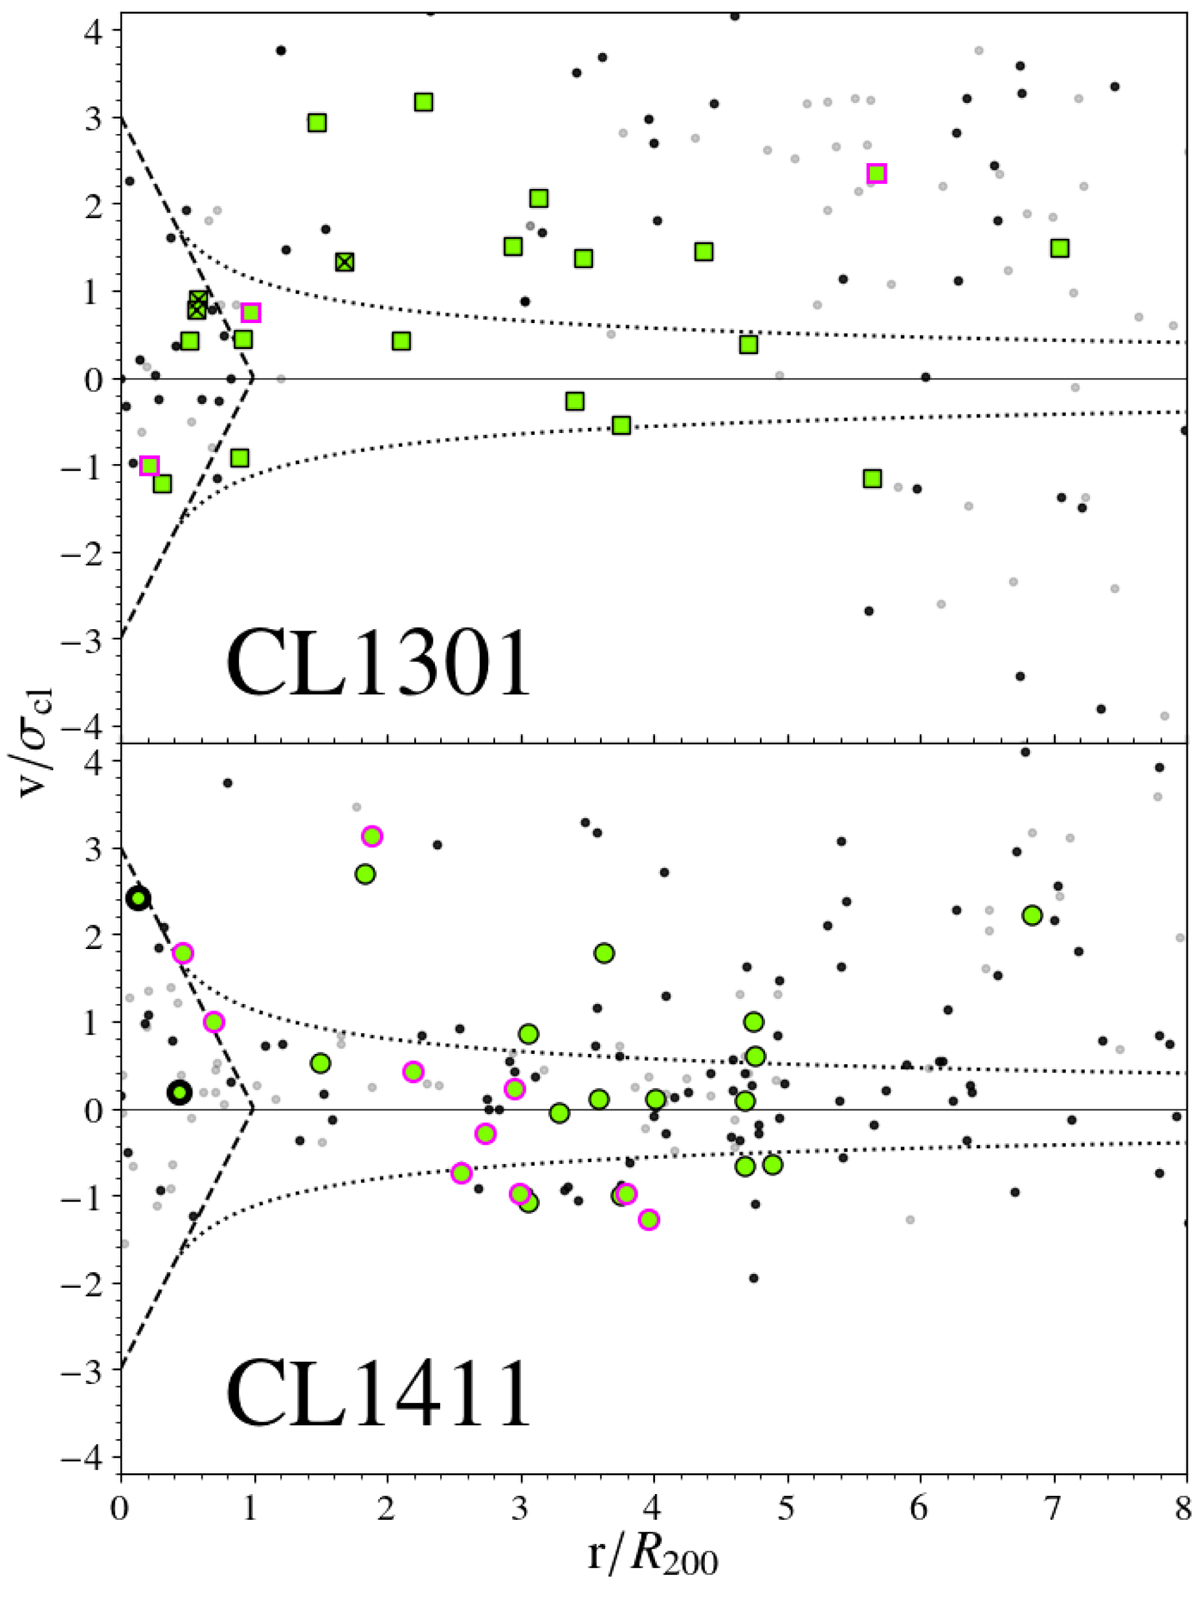
Fig. 10.
Download original image
Projected phase-space diagrams CL1301.7−1139 (top panel) and CL1411.1−1148 (bottom panel). The star-forming (black dots) and passive (grey points) galaxies with spectroscopic redshifts are identified in the UVJ diagram for CL1411.1−1148. As to CL1301.7−1139, when Ks band photometry is missing, the distinction between the two types of galaxies is also based on the positions of the red sequence, and the blue clump in the colour-magnitude diagrams using the u, g, and i bands. Assuming a Navarro-Frenck-White (NFW) halo (Navarro et al. 1996), the area under the influence of the cluster potential, either from small relative velocities or small distance to the cluster cores, is shown with the dotted black line. The dashed black lines indicate the region in which the galaxies are considered to be cluster members (i.e., virialised region, Mahajan et al. 2011).
Current usage metrics show cumulative count of Article Views (full-text article views including HTML views, PDF and ePub downloads, according to the available data) and Abstracts Views on Vision4Press platform.
Data correspond to usage on the plateform after 2015. The current usage metrics is available 48-96 hours after online publication and is updated daily on week days.
Initial download of the metrics may take a while.