Fig. 9.
Download original image
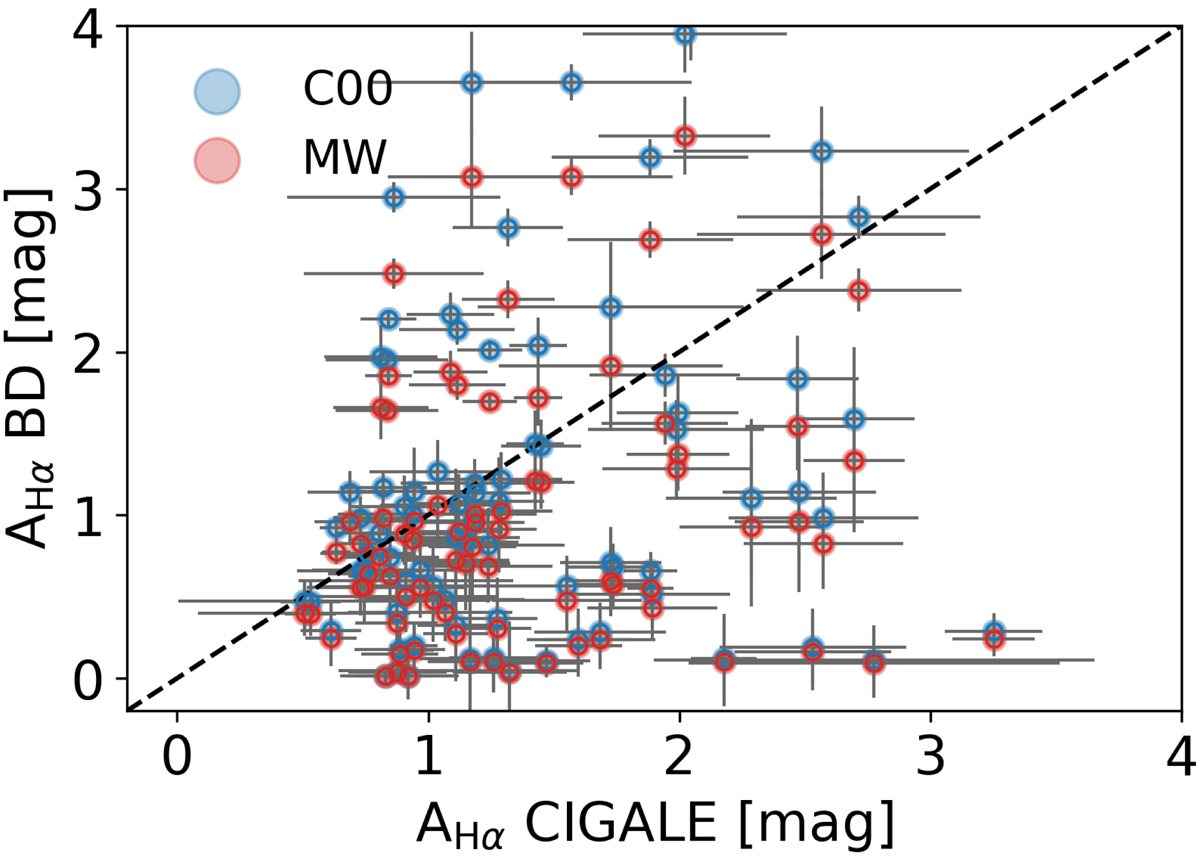
Balmer Decrement and CIGALE’s AHα comparison. Blue and red dots correspond to the BD derived attenuations computed using Eq. (5) and a Calzetti et al. (2000) and Milky Way extinction curve, respectively. The Hα attenuation obtained directly from CIGALE is shown in the x-axis. The 1:1 relation is shown as a dashed black line.
Current usage metrics show cumulative count of Article Views (full-text article views including HTML views, PDF and ePub downloads, according to the available data) and Abstracts Views on Vision4Press platform.
Data correspond to usage on the plateform after 2015. The current usage metrics is available 48-96 hours after online publication and is updated daily on week days.
Initial download of the metrics may take a while.