Fig. 8.
Download original image
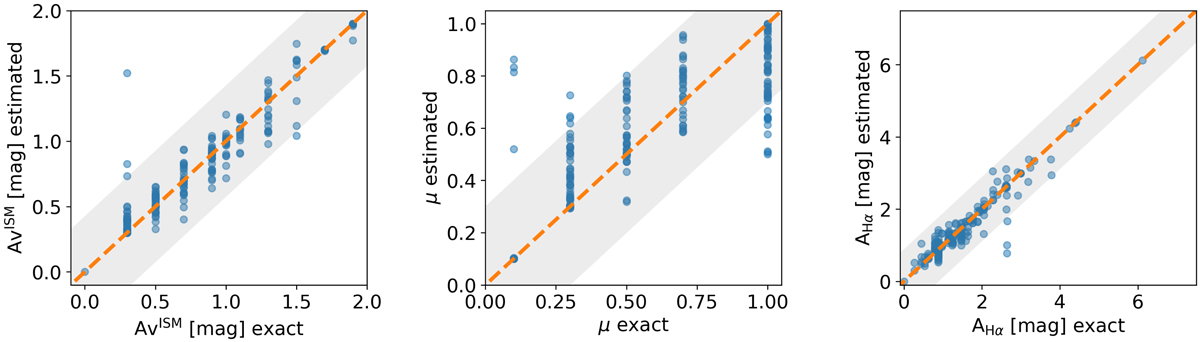
Mock data sets comparison for the CF00 attenuation recipe intrinsic parameters (![]() and μ), and the Hα attenuation. On the y-axis, the estimated values from the mock catalogs are shown. The x-axis corresponds to the exact value retrieved by CIGALE. The dashed line shows the 1:1 relation. The 1σ levels computed as the standard deviation of the estimated parameters are drawn as gray shades.
and μ), and the Hα attenuation. On the y-axis, the estimated values from the mock catalogs are shown. The x-axis corresponds to the exact value retrieved by CIGALE. The dashed line shows the 1:1 relation. The 1σ levels computed as the standard deviation of the estimated parameters are drawn as gray shades.
Current usage metrics show cumulative count of Article Views (full-text article views including HTML views, PDF and ePub downloads, according to the available data) and Abstracts Views on Vision4Press platform.
Data correspond to usage on the plateform after 2015. The current usage metrics is available 48-96 hours after online publication and is updated daily on week days.
Initial download of the metrics may take a while.