Fig. 7.
Download original image
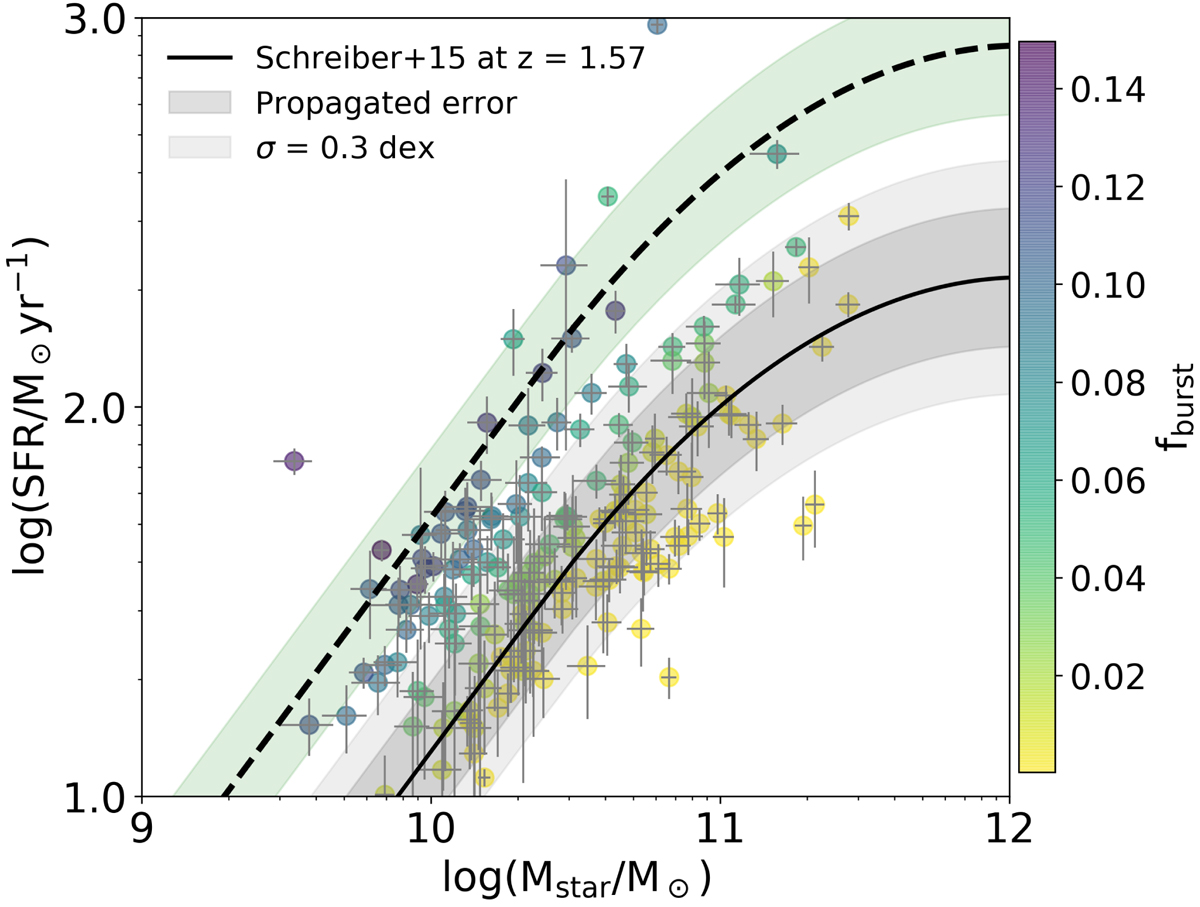
Star-formation rate versus stellar mass diagram. The dashed line corresponds to the Schreiber et al. (2015) curve evaluated at a median sample redshift of z = 1.5. The propagated error dispersion from the fitted errors of the function and a 0.3 dex scatter usually found for the relation in literature are shown as shades. Objects are color-coded by the mass fraction of the late burst population (fburst). Galaxies four times above the main-sequence (black solid line) are consistent with a SED validated starburst population (fburst ∼ 0.1) within the 1σ dispersion shown as green shade area. Bayesian error for SFR and stellar mass are reported.
Current usage metrics show cumulative count of Article Views (full-text article views including HTML views, PDF and ePub downloads, according to the available data) and Abstracts Views on Vision4Press platform.
Data correspond to usage on the plateform after 2015. The current usage metrics is available 48-96 hours after online publication and is updated daily on week days.
Initial download of the metrics may take a while.