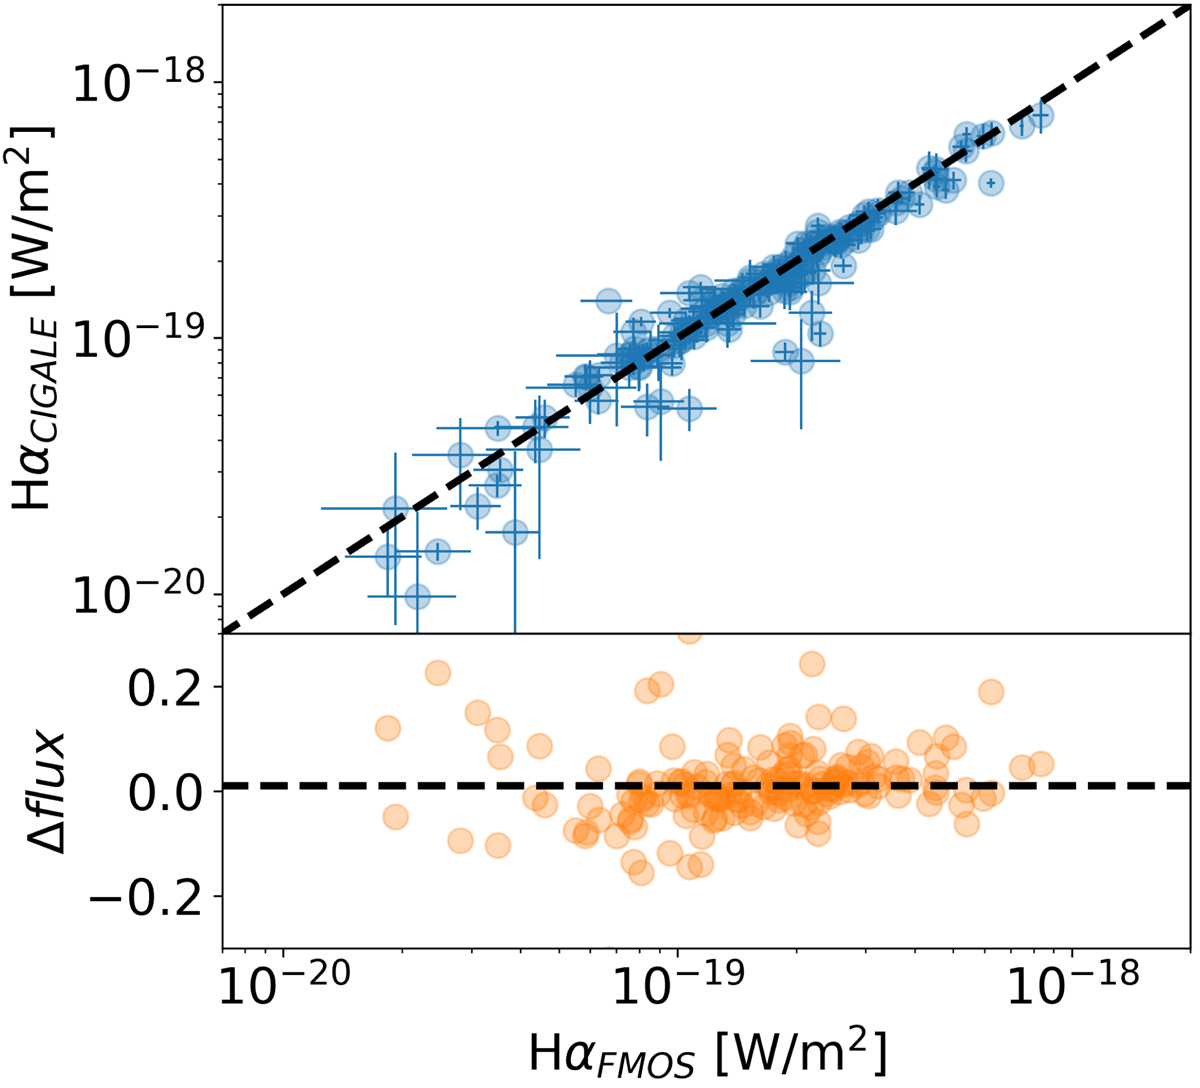
Fig. 6.
Download original image
Fit quality of the Hα emission line. Upper panel: computed Bayesian flux using CIGALE on the y-axis vs the FMOS measured flux in the x-axis. The 1:1 relation is shown as a dashed line. The relative difference in flux is presented in the lower panel in logarithmic scale. Bayesian and measured errors are shown for CIGALE and FMOS Hα fluxes, respectively. The differences between the computed flux with CIGALE and the observed data are not larger than 0.2 dex.
Current usage metrics show cumulative count of Article Views (full-text article views including HTML views, PDF and ePub downloads, according to the available data) and Abstracts Views on Vision4Press platform.
Data correspond to usage on the plateform after 2015. The current usage metrics is available 48-96 hours after online publication and is updated daily on week days.
Initial download of the metrics may take a while.