Fig. 5.
Download original image
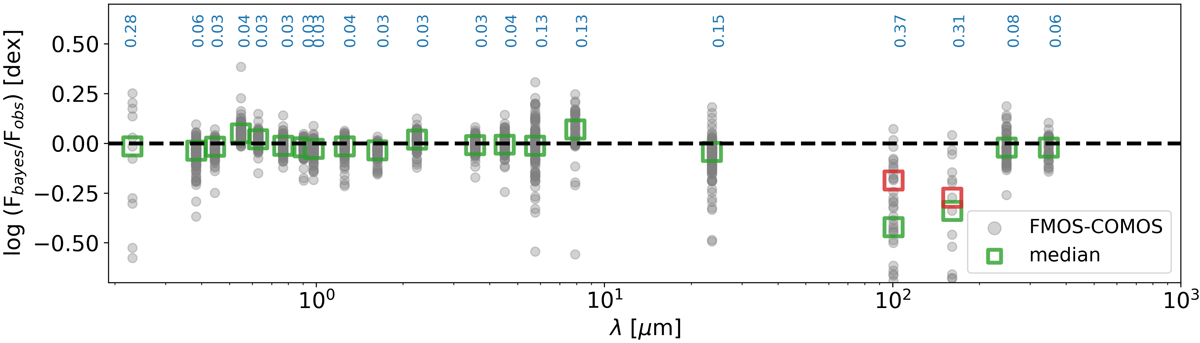
Median distribution of the SED estimated and observed fluxes. On the x-axis, each wavelength corresponds to the photometric bands used in the SED fitting. The difference between the computed Bayesian flux with CIGALE and the observations is shown in the y-axis. Each object in our sample is drawn as a gray dot with a S/N > 3 in each band. Median values are shown as green squares. The median values for objects with S/N > 3 in both Herschel PACS 100 μm and Herschel PACS 160 μm are presented as red squares. Dispersion on the flux difference at each wavelength is reported on top.
Current usage metrics show cumulative count of Article Views (full-text article views including HTML views, PDF and ePub downloads, according to the available data) and Abstracts Views on Vision4Press platform.
Data correspond to usage on the plateform after 2015. The current usage metrics is available 48-96 hours after online publication and is updated daily on week days.
Initial download of the metrics may take a while.