Fig. 17.
Download original image
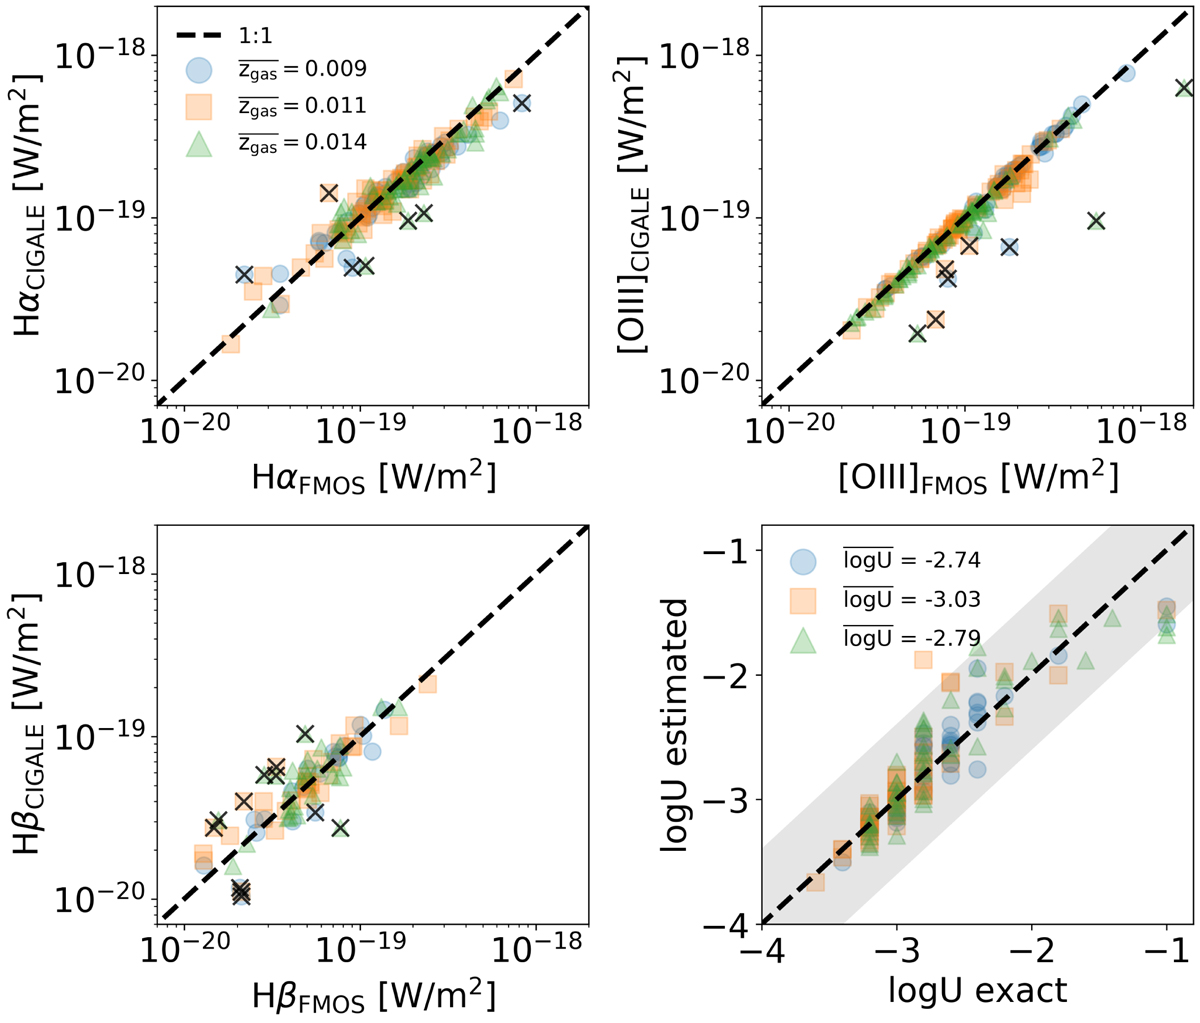
Quality of the fits including Hα, Hβ, and [OIII]λ5007 emission lines and ionization parameter estimation. From left to right, top to bottom: we show the CIGALE fit vs. observed flux for the Hα, [OIII]λ5007, Hβ emission lines. The three different gas-phase metallicity bins are presented as blue circles, orange squares, and green triangles. The black crosses correspond to excluded data with flux difference larger than 0.2 dex. The black line corresponds to the 1:1 relation. The three emission lines are well fitted for the three different median gas-phase metallicity models. Last panel: estimated vs exact value for log U from mock samples created with CIGALE. Symbols are the same as the legend in the first panel and the median ionization parameter value is shown. The shaded area corresponds to the standard deviation.
Current usage metrics show cumulative count of Article Views (full-text article views including HTML views, PDF and ePub downloads, according to the available data) and Abstracts Views on Vision4Press platform.
Data correspond to usage on the plateform after 2015. The current usage metrics is available 48-96 hours after online publication and is updated daily on week days.
Initial download of the metrics may take a while.