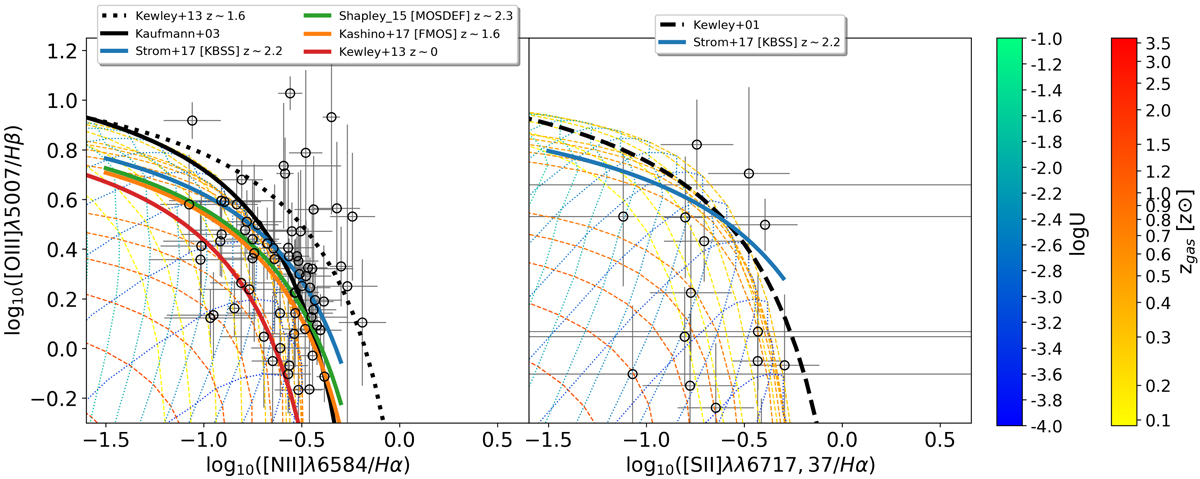
Fig. 16.
Download original image
Excitation diagnostic diagrams. Left: Baldwin-Phillips-Terlevich (BPT) diagram ([OIII]λ5007/Hβ versus [NII]λ6584/Hα). The new models implemented in CIGALE are color-coded by gas-phase metallicity in solar units and ionization parameter log U. Only a few metallicities are shown for clarity. The FMOS-COSMOS sample is shown as gray dots with error bars. The solid black line corresponds to the Kauffmann et al. (2003) relation and the dashed-black line corresponds to Kewley et al. (2013a) evaluated at z ∼ 1.6. The curves of Shapley et al. (2015), Kashino et al. (2017), and Strom et al. (2017) are shown in green, orange, and blue, respectively. The red line represents the local-universe locus of galaxies as shown by Kewley et al. (2013a). Right: [SII]λλ6717,31 excitation diagram ([OIII]λ5007/Hβ versus [SII]λλ6717,31/Hα). The current models implemented in CIGALE are color-coded by gas-phase metallicity and ionization parameter log U to illustrate the coverage. Only a few metallicities are shown for clarity. The FMOS-COSMOS sample is shown as black circles with error bars. The dashed black line corresponds to the results from Kewley et al. (2001) and the blue line to Strom et al. (2017).
Current usage metrics show cumulative count of Article Views (full-text article views including HTML views, PDF and ePub downloads, according to the available data) and Abstracts Views on Vision4Press platform.
Data correspond to usage on the plateform after 2015. The current usage metrics is available 48-96 hours after online publication and is updated daily on week days.
Initial download of the metrics may take a while.