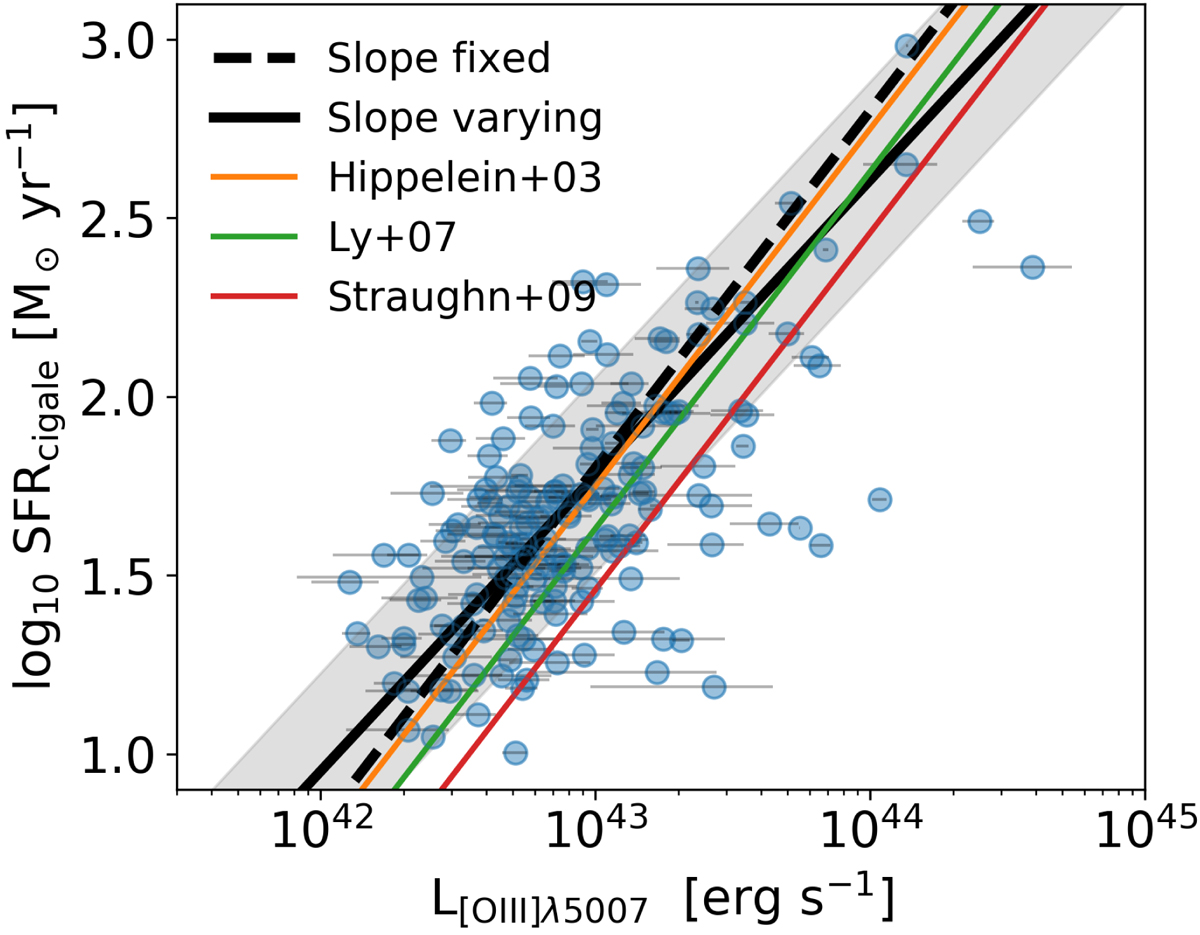
Fig. 14.
Download original image
[OIII]λ5007 corrected luminosity and SFR relation. The dashed and continuous black lines correspond to fits using a bootstrapped orthogonal distance regression method with a Spearman’s regression coefficient ρs = 0.57. The 0.32 dex dispersion from the standard deviation is presented as a gray shaded area. The relation shows a positive correlation with scatter significantly higher compared to Kennicutt (1998) Hα relation. Relations proposed by Hippelein et al. (2003), and Ly et al. (2007) are shown in orange and green, respectively. Straughn et al. (2009) is also presented in red for comparison. Relations are converted from Salpeter to Chabrier IMF.
Current usage metrics show cumulative count of Article Views (full-text article views including HTML views, PDF and ePub downloads, according to the available data) and Abstracts Views on Vision4Press platform.
Data correspond to usage on the plateform after 2015. The current usage metrics is available 48-96 hours after online publication and is updated daily on week days.
Initial download of the metrics may take a while.