Fig. 12.
Download original image
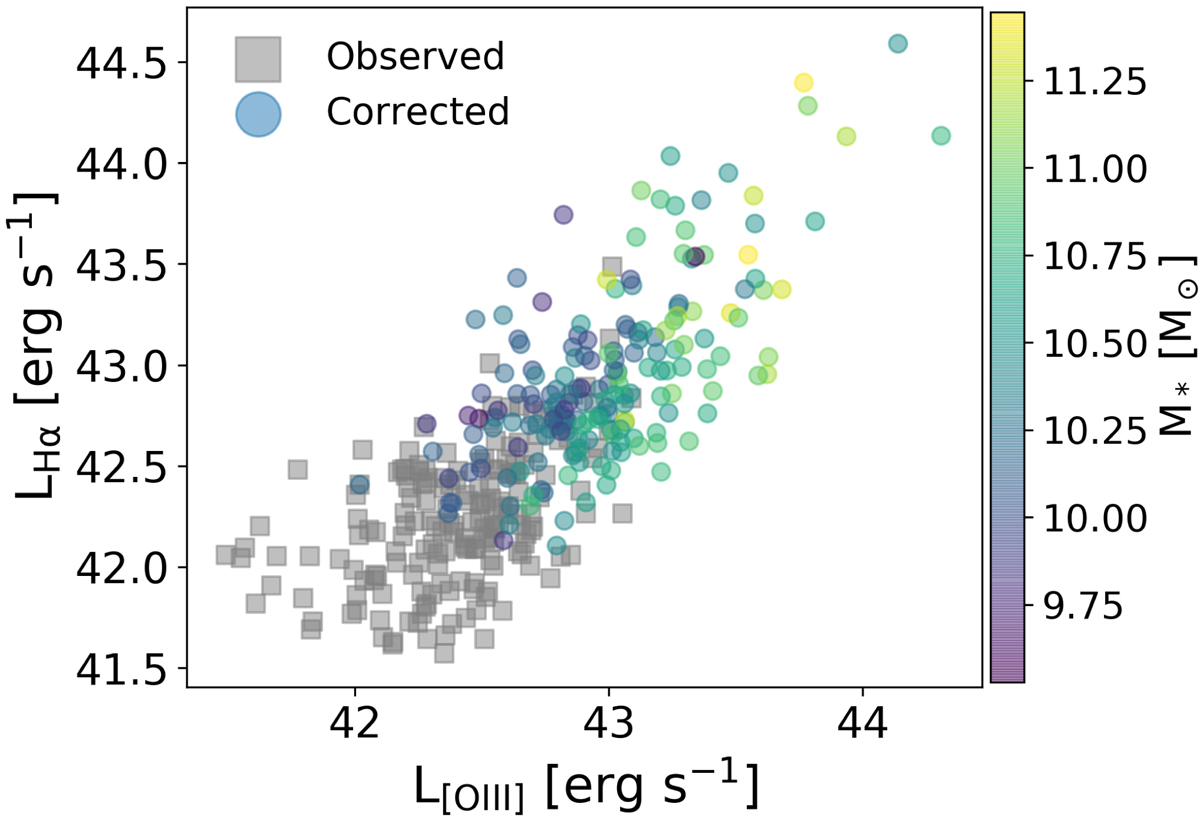
Hα and [OIII]λ5007 luminosity. The observed luminosities uncorrected for dust are shown as gray dots. The color dots correspond to luminosities de-reddened using AHα and A[OIII] as constrained by the SED fitting with CIGALE. The corrected data is color-coded by the stellar mass. A slope of 0.99 is measured in the dust corrected sample with a 0.39 dex dispersion.
Current usage metrics show cumulative count of Article Views (full-text article views including HTML views, PDF and ePub downloads, according to the available data) and Abstracts Views on Vision4Press platform.
Data correspond to usage on the plateform after 2015. The current usage metrics is available 48-96 hours after online publication and is updated daily on week days.
Initial download of the metrics may take a while.