Open Access
Fig. 11.
Download original image
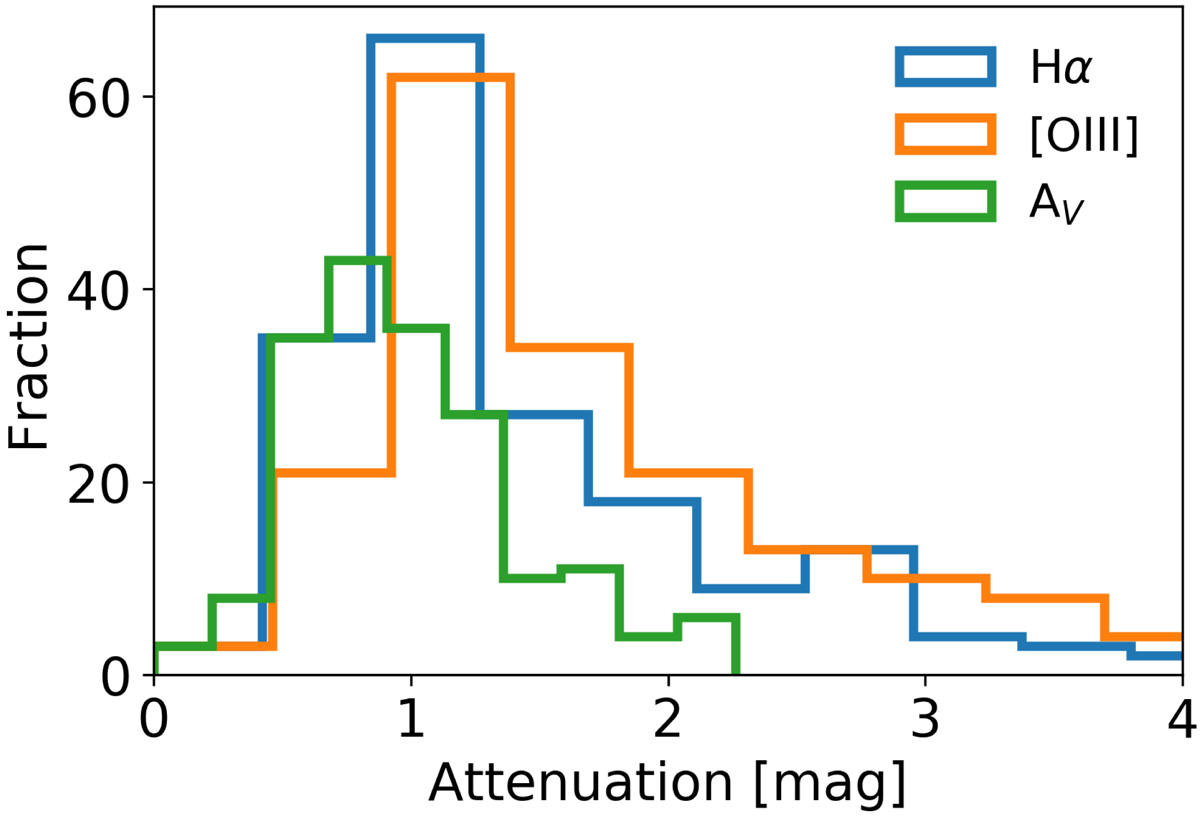
Distribution of the total attenuation in the Hα and [OIII]λ5007 emission lines and the V-band are shown in blue, orange, and green, respectively. The amount of attenuation obtained for the emission lines is similar.
Current usage metrics show cumulative count of Article Views (full-text article views including HTML views, PDF and ePub downloads, according to the available data) and Abstracts Views on Vision4Press platform.
Data correspond to usage on the plateform after 2015. The current usage metrics is available 48-96 hours after online publication and is updated daily on week days.
Initial download of the metrics may take a while.