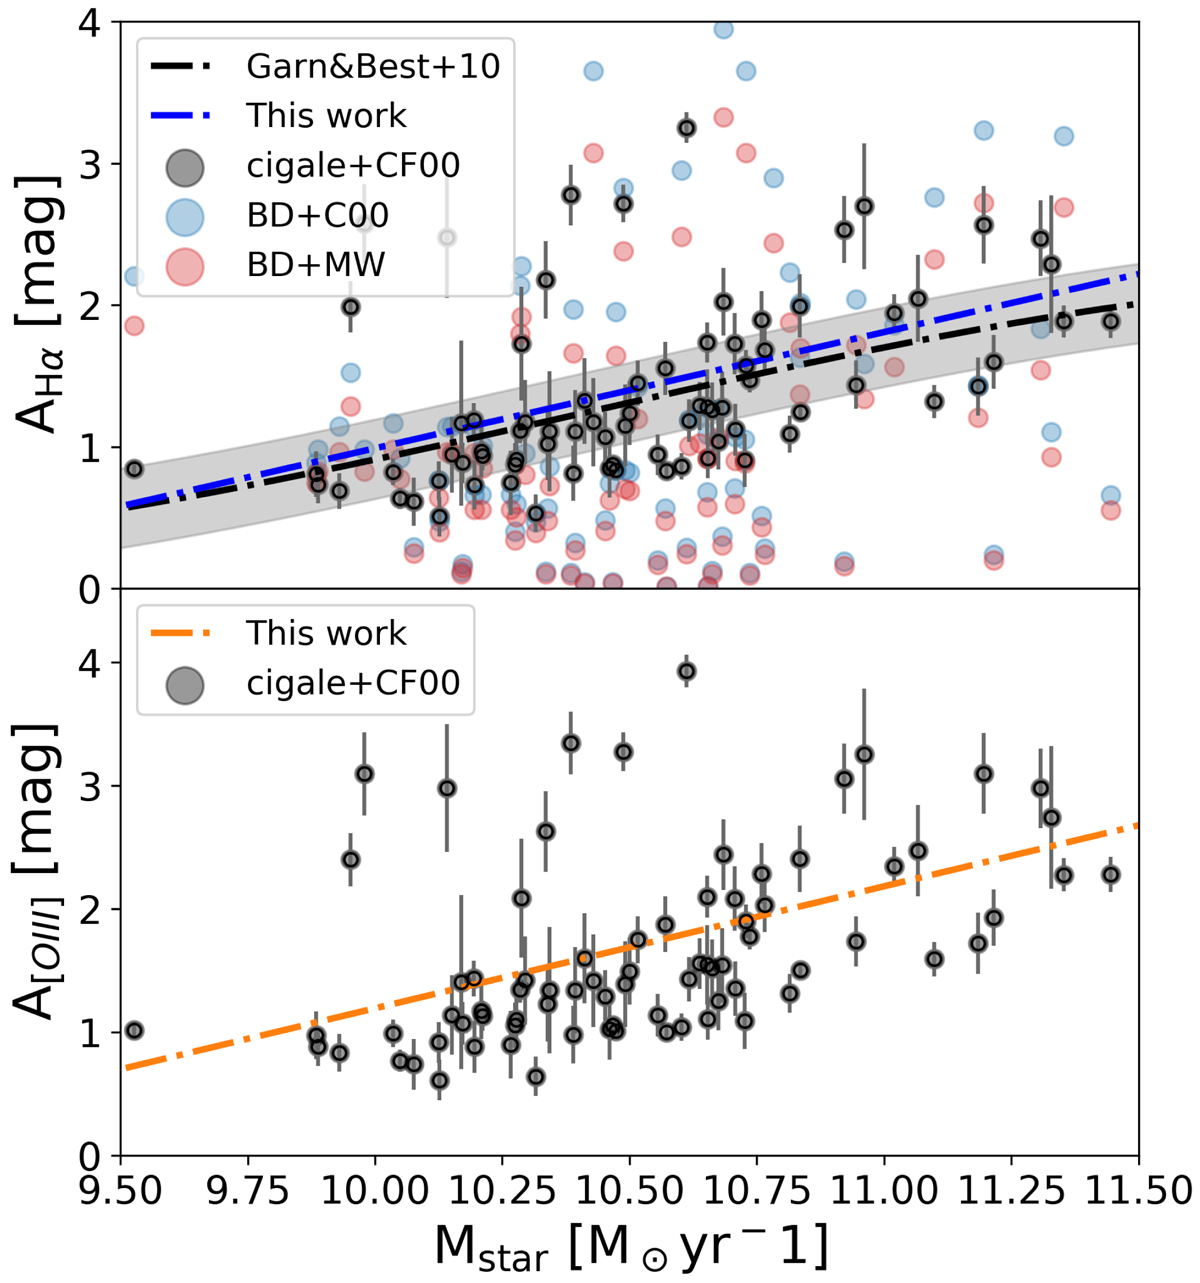
Fig. 10.
Download original image
Variation of the AHα, and A[OIII] attenuation with the stellar mass. The attenuation computed with CIGALE is presented as black dots with their respective uncertainties. Milky Way and C00 are shown in red and blue, respectively without uncertainties for clarity on the upper panel. The dashed line corresponds to the AHα − Mstar relation obtained by Garn & Best (2010) in the local universe. The shaded area indicates the relation’s ± 1σ distribution width. The blue line represents a linear fit to the black dots. Lower panel: attenuation retrieved for the [OIII]5007 emission line. A linear fit is shown in orange.
Current usage metrics show cumulative count of Article Views (full-text article views including HTML views, PDF and ePub downloads, according to the available data) and Abstracts Views on Vision4Press platform.
Data correspond to usage on the plateform after 2015. The current usage metrics is available 48-96 hours after online publication and is updated daily on week days.
Initial download of the metrics may take a while.