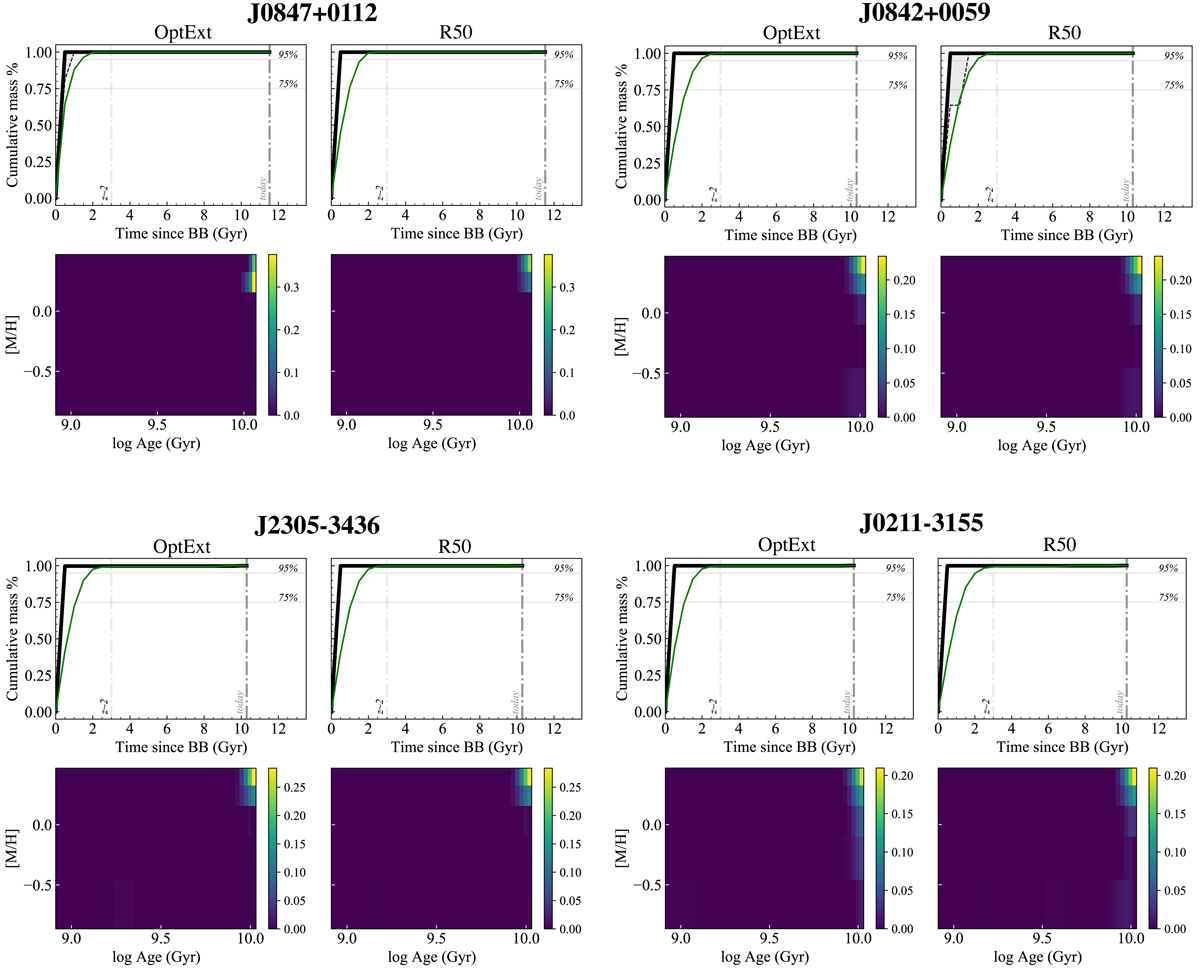
Fig. 9.
Download original image
Star formation history of the four extreme relics (M⋆≥99% at tBB=3 Gyr). The systems are ordered in descending order of degree of relicness. Upper plots of each panel: cumulative stellar mass fraction formed in time, starting from the BB and up to the age of the Universe at the redshift of each system, which is plotted as a vertical dashed line. The other vertical line shows instead the 2 Gyr threshold used in the text to classify an object as an extreme relic. Black lines show the result obtained from the unregularised PPXF fit with the best value of [α/Fe] estimated from line indices. The shadow regions show the uncertainties on such estimates (±0.1). Finally, the green lines show the results of the fit performed with the regularisation set to the MAX_REGUL. Bottom plots of each panel: 2D density plot of the weights attributed to the SSP models by PPXF in the log (age)–[M/H] space. The colour bar shows the weight fractions of the SSP models with the corresponding age and metallicity used in the fit.
Current usage metrics show cumulative count of Article Views (full-text article views including HTML views, PDF and ePub downloads, according to the available data) and Abstracts Views on Vision4Press platform.
Data correspond to usage on the plateform after 2015. The current usage metrics is available 48-96 hours after online publication and is updated daily on week days.
Initial download of the metrics may take a while.