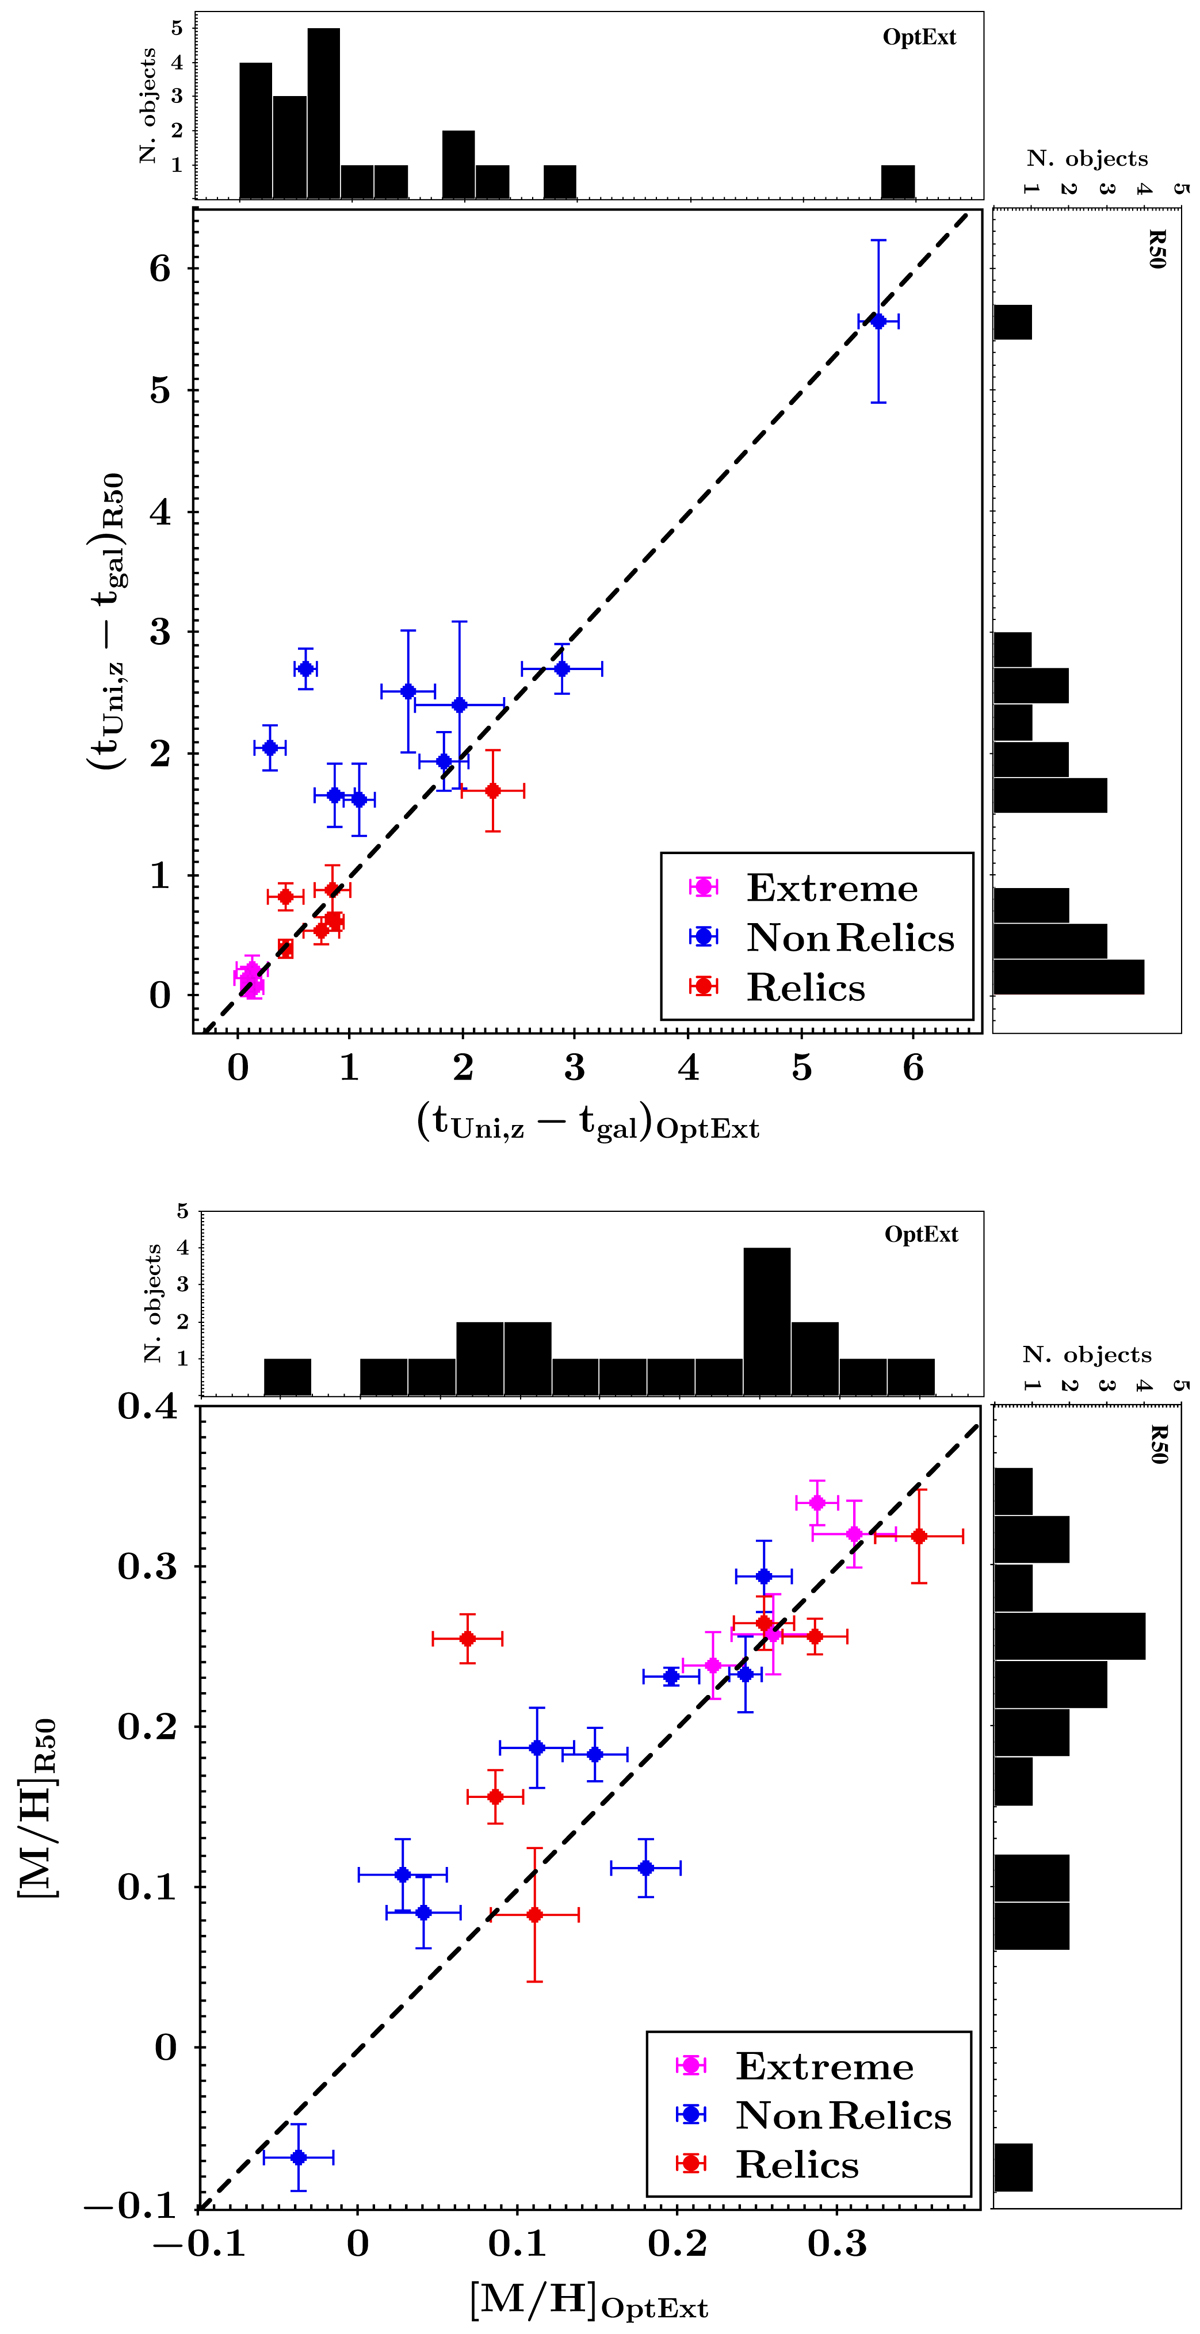
Fig. 7.
Download original image
Scatter plots of the formation times (top) and metallicities (bottom) derived from the OptExt (x-axis) and the R50 (y-axis) for the INSPIRE DR1 objects, which are colour coded according to their relic class (Sect. 7.2). In all panels, we always plot the mean between the values obtained with REG = 0 and with the MAX_REGUL, and show the one-to-one line (dashed black). The bins in the histograms are chosen to be as similar as possible to the uncertainties on the relative quantities.
Current usage metrics show cumulative count of Article Views (full-text article views including HTML views, PDF and ePub downloads, according to the available data) and Abstracts Views on Vision4Press platform.
Data correspond to usage on the plateform after 2015. The current usage metrics is available 48-96 hours after online publication and is updated daily on week days.
Initial download of the metrics may take a while.