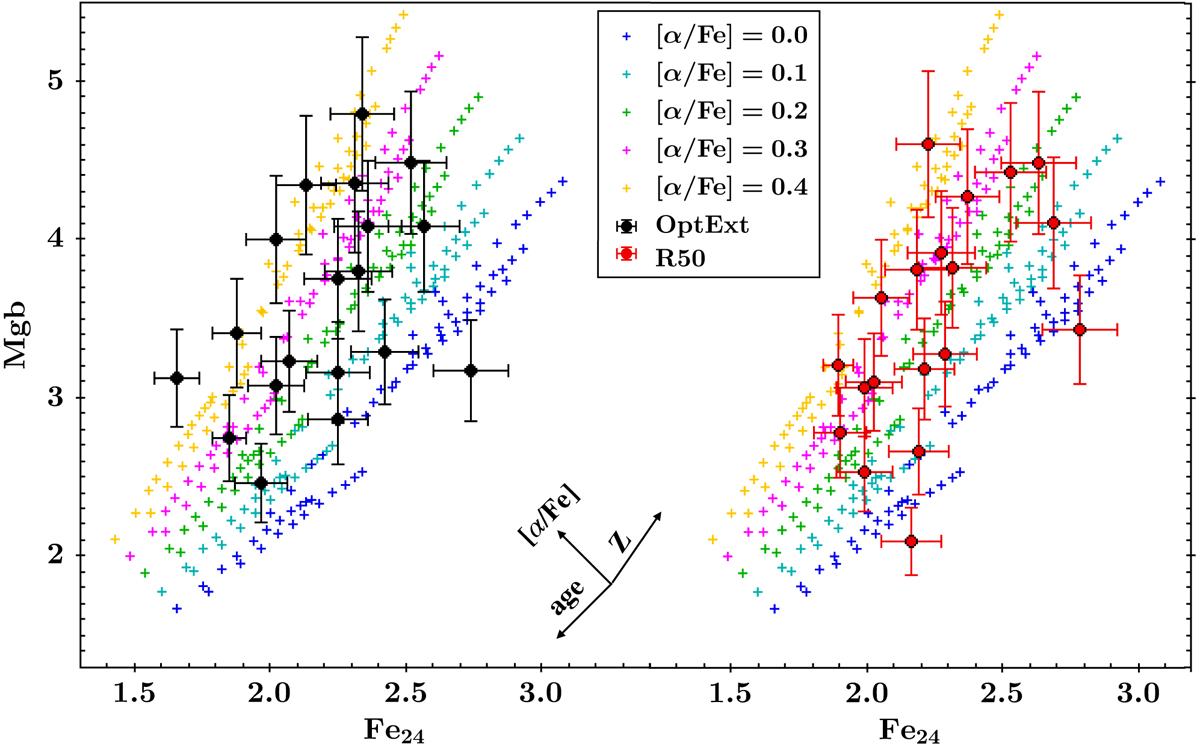
Fig. 6.

Download original image
Mgb-Fe24 index–index plot used to infer the [Mg/Fe] for the OptExt (black, left) and R50 (red, right) spectra. The F24 index is the mean of the 24 iron lines present in the spectral range [3500−6500] Å. Coloured crosses are MILES SSPs with different ages and metallicities and colour-coded according to their [α/Fe] value. Black arrows show the direction of the variation expected by varying the stellar population parameters (age, Z, [α/Fe]). Both galaxies and SSP line strengths are calculated after convolving the spectra to a common resolution of σ = 300 km s−1.
Current usage metrics show cumulative count of Article Views (full-text article views including HTML views, PDF and ePub downloads, according to the available data) and Abstracts Views on Vision4Press platform.
Data correspond to usage on the plateform after 2015. The current usage metrics is available 48-96 hours after online publication and is updated daily on week days.
Initial download of the metrics may take a while.


