Fig. 5.
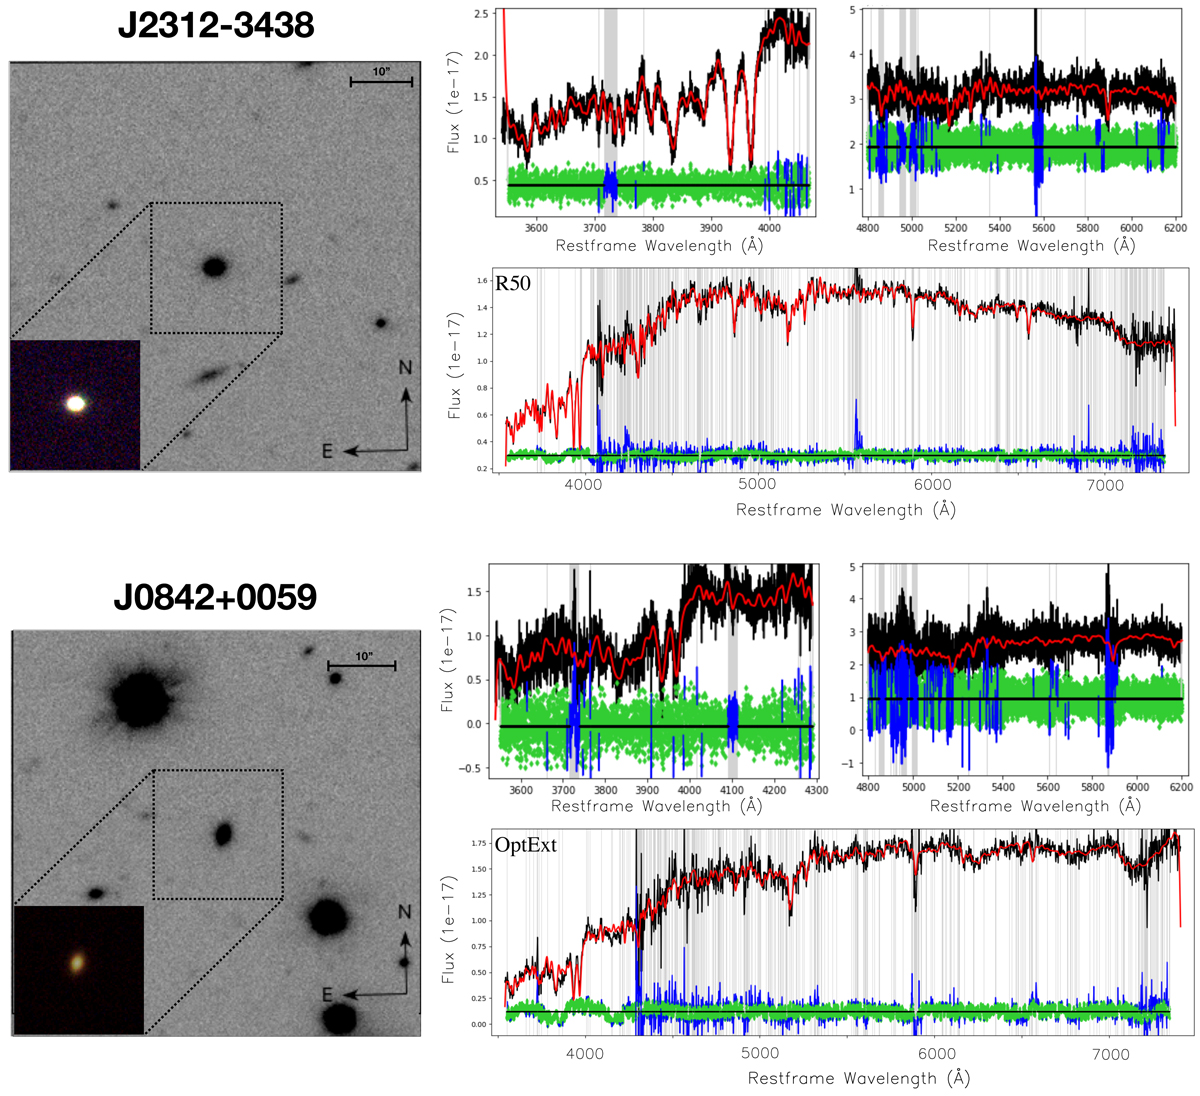
Download original image
Two of the 19 target systems of this INSPIRE DR1. From top to bottom: J2312−3438, the object with the spectrum with the highest mean S/N (∼55 per Å), and J0842+0059, that with the lowest mean spectral S/N (∼22 per Å; see Table C.1). For each object, left panel: 1′×1′ cutout of the KiDS r-band image with the relic candidate in the middle. The zoom-in panel shows a gri-colour (KiDS) image of 20″ × 20″. Right top panels: result from the PPXF kinematic fit (left UVB, right VIS, described in Sect. 5), right bottom panel: stellar population fitting (UVB+VIS, Sect. 6) one time in the case of the R50 spectrum (top) and one time for the OptExt (bottom). In all the panels, we plot in red the best-fit stellar template, in green the residuals and in blue and grey bands the pixels which have been masked out from the fit. All the spectra are plotted at the restframe wavelength and in units of Flux normalised by 10−17. In the kinematic fit the black spectra are plotted at their original resolution. In the stellar population one, these are smoothed to a resolution of FWHM = 2.51 Å.
Current usage metrics show cumulative count of Article Views (full-text article views including HTML views, PDF and ePub downloads, according to the available data) and Abstracts Views on Vision4Press platform.
Data correspond to usage on the plateform after 2015. The current usage metrics is available 48-96 hours after online publication and is updated daily on week days.
Initial download of the metrics may take a while.